|

With this chapter we will directly see the harmonic structures that are
visible in time, and the direct geometry that goes along with them. Once we
have done so, the theoretical foundations for the universal applicability of
the Nineveh Constant will be easily seen, as our Galaxy is also operating
under these harmonic geometries in time. So obviously, the very first
question that comes to mind is this: even if we knew that we were looking
for Platonic geometry, how could we chart out the passage of time in such a
way as to have a solid measurement of its effects that might allow us to see
such a structure? Almost all graphs that we see, regardless of what
phenomena in time that they are measuring, are expressed in two dimensions
-- an X axis and a Y axis. How would we be able to use such a graph to
visualize a Z axis and thereby extend our perception of the effects of time
out into three dimensions?
The even more fundamental question is this: "How do we know whether time is
simply a static, "linear" phenomenon that produces no changes within nature
in and of itself as it passes by, or an active, "topological" phenomenon
that produces predictable, recurring patterns in neatly organized cycles?"
What possibly could we look for in trying to discover if time has a dynamic
shape? In order to hope to see a shape of any kind, we would have to find
something that changes, something that does not stay the same but has the
potential to move in different, measurable directions.
We have already shown the proof that Light itself has just such an active,
topological structure -- and our one of our original arguments, seen in both
the "Unified Field" theories of John Nordberg and
Dewey Larson, is that all
of Space is filled with a sea of Light that we do not normally observe. Our
scientific evidence as well as excerpts from Ra and W.B. Smith’s
UFO lecture
suggest that these Light harmonics have different density levels in
different areas of the Universe. The Sun had been maintaining the octahedral
level nicely for us, even though the Ulysses probe did not detect any
polarized magnetic field in 1995.
Furthermore, all of the sources we have just mentioned are telling us that
Time itself is a function of Light. In the case of John Nordberg’s physics,
he explains that all of the universe is made up of balls of light, which we
have called Consciousness Units. In Nordberg’s model, (which will be covered
in much more detail in Convergence: The Physics of Ascension,) these balls
of light can either remain stationary as "standing waves" (as in the case of
ball lightning) or move at the speed of Light, becoming "moving waves" or
photons that create visible light. Even though a "standing wave" does not
appear to be moving through space, it certainly possesses dynamic internal
motion -- and this will be a motion that corresponds to its own frequency of
vibration. In the case of the third dimension or density, our light harmonic
is 144, and the Hindu geometric cosmology tells us that Light forms the
structure of an octahedron in our area.

And so, the ultimate assertion that we will make is that motion is what
creates "standing waves" of Light, which will naturally form spherical
harmonics in models such as Nordberg’s. The motion of a large body, such as
a planet or star, will create harmonics as it drags along the aether in its
motion, thus creating a "standing wave" in the System that it is contained
within. Wherever the center of gravity is, such as the Sun in the Solar
System or the Center in the Galaxy, the harmonics will arrange themselves
around that point. In other words, any large mass must draw in the Light of
Space around itself to sustain its existence, becoming an ’aether sink’ to
the surrounding area in the same manner as a low-pressure zone in our
atmosphere causes high-pressure air to move into it, thus creating
thunderstorms. When you have such a sink in motion, such as in the orbit of
a planet or galaxy, it naturally disturbs its environment and creates
vibration as it travels, just as the froth of water that follows a motorboat
continues to ripple outwards after it has passed by a certain area. And in
the case of the disruption of aetheric energy, we know from many researchers
that these vibrations can be seen as light, sound and geometry.
We have discussed previously the fact that Jupiter-Saturn conjunctions are
the main ’driver’ for the Mayan Calendar. What we have not mentioned is that
these conjunctions always happen in the exact same three areas of space,
relative to the Sun. These areas are equally spaced and thus form a great
equilateral triangle:
Furthermore, each 19.86-year J-S conjunction is also very close to
one-quarter the total length of Uranus’ orbit. Again, in previous times this
may have been more exact than it is at present, due to the explosion of Maldek. So if we divide Uranus’ 84-year orbit into similarly harmonic
quarter-cycles, we end up with a giant square that is formed in its orbit
around the Sun, also a harmonic that is seen to overlap with the Mayan katun
and / or the J-S conjunction:
Other planetary cycles, once further explored, should yield other geometries
as well, including pentagons and hexagons. And if we go back to the study of
the crop circles, we remember that the work of Gerald Hawkins showed us that
two-dimensional diagrams like these can in fact be hyper-extended to three
dimensions. And already, we have seen that the three-dimensional octahedron
appearing in the Sun is responsible for the positive and negative energy
bombardments that we receive twice a month on the Earth. And when we look at
the behavior of a system such as the Great Red Spot in Jupiter at 19.5
degrees latitude, we can assume that a similar harmonic outpouring of Light
energy is occurring from the tetrahedral level, slowly moving like a giant
lawn sprinkler in the Solar System as Jupiter rotates:
So, the rotations of the planets and grids themselves, combined with the
planet or star’s motion through space, create a variety of interconnecting
harmonics. Some of these harmonics will move very slowly compared to the
speed with which our Earth passes through the Light of Space, as we complete
twenty cycles around the Sun to add up to one conjunction of Jupiter and
Saturn, for example. Therefore, it is certainly possible for us to pass into
and out of areas of greater or lesser energetic concentration -- and this
appears to be the basis of astrology. If these energies are more than just a
simple "hot-or-cold," "high-or-low" variable and instead represent discrete
archetypes of consciousness, then as certain archetypes are flooding more
powerfully into our minds, we can expect that more of those corresponding
personality traits in ourselves will be visible. The entire Solar System
would become a vast webwork of intertwining three-dimensional harmonics,
just as an astrology chart will show you in two dimensions.
Our simplified diagram of the spiraling tetrahedron does not reveal the full
extent of these harmonic pulsations. We must look at the entire shape itself
as being a harmonic stress point, not just the tips. Therefore, the exact
structure of the "standing wave" in free space will act as an attracting
force, causing the very lifeblood of Consciousness to be affected as all
other forces pass through it. And if we are looking for these properties in
time, our next challenge would be to find a way to actually measure such
changes, in order to determine if there is such a force in effect. Since
these effects are related to consciousness and thereby psychological in
nature, we must find a simple way of charting out the behavior of human
psychology on a mass scale.
Furthermore, if we want to insure that these changes could not possibly be
caused by anything but the passage of time, then all other factors involved
with the changes should be as completely random as possible. In other words,
whatever we are graphing should appear to be an almost completely
unpredictable psychological phenomenon that is very easy to measure, ideally
with only two "hot or cold, high or low" variables to consider. And then, if
this behavior is truly a random event by all conventional understandings,
any patterns taking effect should be a byproduct of our observable
higher-dimensional geometric structures in time. Such "patterns in chaos"
have indeed been observed in many different ways already, and they are
commonly referred to in modern "Chaos theory" as forming "fractal"
geometries, like the Mandelbrot Set. Until now, with our aetheric models in
place, we have never truly had a foundation with which to understand how
these fractal formations could be seen in both space and time.
Again, if we want to chart out human behavior to see if the passage of time
has any observable effect, the first thing we have to do is to find a very,
very simple index for measuring that behavior. Ideally we should investigate
some form of human behavior that essentially has only two directions - up or
down, positive or negative, high or low, joy or fear, prosperity or
scarcity. This measurement of human behavior would need to be rigorously
graphed day after day in an ongoing fashion in order to accurately analyze
the long-term data for any trends or patterns. In order to be truly
scientific, it would have to be something that was kept fastidiously, with
no interruptions, for as long as possible. No one research group could
realistically attempt to do such a broad-based study on their own, as they
would be likely to introduce their own biases -- and furthermore, we simply
don’t have the profit motive to graph such behavior with steadfastness. Or
do we?
THAT’S RIGHT… THE STOCK MARKET!
It just so happens that we do not need to look very far to find such an
ongoing measurement index of human behavior. Ever since the late 1700’s, at
the dawning hour of a new nation known as the United States of America, an
accurate record of the human extremes of joy and fear have been rigorously
documented and rendered into the form of an ongoing graph. This record is
known to us as the stock market of the United States, later referred to as
the Dow Jones Industrial Average.
Yes indeed, the final answer to proving the geometric structure of time will
come to us from the study of the stock market. As surprising as this may
seem, it is indeed the most obvious and specific means by which we can graph
out the extremes of human behavior through time. The measuring index of this
behavior would be the price scale, which always occupies the Y axis of a
stock market graph. And thus, the relative price value of the stock market
is indeed a very direct and very effective measurement device for collective
human behavior. When human beings feel joy, prosperity and inspiration, they
confidently buy, buy, buy into the stock market, rising the price index. And
when human beings suddenly begin to feel fear, scarcity and panic, they
quickly sell, sell, sell their stocks, hoping to bail out of the market
before it gets any worse.
Indeed, any simple study of a stock market graph will show us that it
continues to move up and down, up and down as time moves forward. Rarely do
we ever see a stock market graph "flatline" for any prolonged period of
time, and even within the larger trends, smaller oscillations are usually
seen as well. The structures of human behavior indeed take on a dynamic
shape as the collective mood of humanity rises and lowers from hope to
despair, over and over again. And these cycles of human behavior have been
intensely studied by many, many different researchers, as there is a very
real profit motive in understanding their functions. If it can indeed be
proven that these up-and-down movements can be predicted in advance, then
all the sport and intrigue of playing the stock market is eliminated. If you
know exactly when the market has bottomed out and can go no lower, then you
know exactly when to buy your stock. And if you know exactly when the market
has topped out and can go no higher, then you know exactly when to sell your
stock, and thus make as much of a profit as you were willing to allow
yourself to make, based upon how much money you invested in the first place.
A MASONIC SCHOLAR USES "ATLANTEAN KNOWLEDGE" TO REVEAL THE HIDDEN STRUCTURE
OF THE MARKET
We have already cited a great deal of evidence that suggests that the true
knowledge of this octave-based system of hyperdimensional geometry that we
are now discussing has been secretly known all along. The society of
Freemasons is one current guise of this "secret society" that has preserved
this knowledge, which found its way into cathedral windows, the Great Seal
of the United States and the United Nations Meditation Room mural, among
other things.
On the outside, the Masonic Order appears to be nothing more than another
boring fraternal "lodge" of aging men like the Shriners, Moose
Lodge, Lions, Kiwanis or Elks Club, but to those who have spoken from the inside, there is
a very complex and interwoven system of Atlantean understandings that has
been handed down over time to them. So, with the idea that everything we
have discussed and more may already be known by a handful of elites upon
this planet, let us investigate the work of ace stock trader W.D. Gann. We
know for a fact that Gann was a high-level initiate in the Masonic secret
society, and he actively came forward into the public to teach how very
similar principles as what we have been studying could be applied to the
stock market. Gann’s work did indeed allow him and many others to make
accurate predictions of market trends in certain cases, though not on a
constant basis. And now, a much more recent researcher by the name of
Bradley Cowan appears to have discovered all of the unspoken and unrevealed
knowledge within Gann’s works - knowledge which Gann apparently did not want
to release because of his secret Masonic oaths. This knowledge ties directly
into our understandings of time as a multi-dimensional, geometric
phenomenon, hence the title of the first of Cowan’s works, Four-Dimensional
Stock Market Structures and Cycles.
But before we discuss Cowan, we must start with Gann. The essential core of
Gann’s discoveries is concerned with the idea that the combined price and
time movement of the stock market will arrange itself into units of specific
length and specific direction. These units of length and direction were
referred to as "radii vectors." The length and value of such a vector is
calculated by observing the nearest substantial high and low points of a
stock market graph, and then drawing a straight line between those two
points that represents a combined, numerical value of price and time. (In
other words, you want to combine the movement of price and time values into
a whole, unified number instead of separating them and only analyzing one at
a time. We will explain Gann’s method of doing this below.) Based on this
rather simple system, once you calculate the value of the radius vector, you
automatically know that the next vector will be exactly the same length.
Without a knowledge of the harmonic structures in time, it may seem
impossible, but Gann gathered mountains of evidence to prove that that’s
"just the way it works."
Furthermore, and significantly, all possible movements of the stock’s value
will always be contained within a simple, harmonic oval or ellipse that can
be drawn around each radius vector. In other words, once you have your
radius vectors clearly mapped out on paper, simply representing the
connecting lines between the highest and lowest cycles of price-time
behavior, you would never see the stock market graph move outside of each
ellipse. Gann showed that the length of this harmonic ellipse is identical
to the length of the radius vector, and the ellipse’s full width, at a
perpendicular angle to the midpoint of the radius vector, will always be
exactly half of this length. The next picture allows us to see this very
clearly.
Again, Gann revealed that the stock graph will never move outside of the
perimeter of this ellipse, providing that you accurately know the true
direction of the radius vector. This information regarding the ellipse is
actually very important for our final theories of hyperdimensional physics,
and thus we will soon see that we are not simply wasting space here by
discussing this.
The next basic point of Gann’s theory that we must discuss is that each time
that you reach the end of a radius vector, you know to watch for the
direction that the next vector will begin to take. Once you know the
direction of the next radius vector, you will already know exactly how far
it will go in terms of length before terminating, since the length is a
constant -- in other words, it is a fusion of price and time values that
will always have approximately the same numerical value when combined
together. You may have a great movement in time and very little movement in
price, and the fusion of these values could be the same as an equal movement
in time and in price or a great movement in price in a very short time.
Obviously, the large price movement in a short time would be the one to
watch for.
[Note: In order to protect Cowan, we are actually not going to reveal enough
information for this idea to be reliably used with success for stock
trading. As one of Cowan’s clients reported, "If you only pay attention to
one cycle and do not consider all the others, then something else will come
along and blow you out of the water." So, if you want to invest money using
these ideas, we strongly suggest that you purchase Bradley Cowan’s books.
The ordering information is available from
his website]
We must also remember that the length of each radius vector is a function of
both price and time moving together, and thus unless price and time are
equally balanced out against each other, (which is rather easily done,) the
lengths of the radii vectors may appear to be different when measured with a
ruler. Therefore, Gann asked us to "square our charts," or to produce a
chart where there was a perfect one-to-one relationship between price and
time. This is how we would create balance in the chart. We would first take
the overall average of a stock’s movement in price for whatever length of
time the graph is working with, whether hourly, daily, weekly or yearly.
Once you get the average movement of that particular stock’s price for each
hour, day or the like, you then re-draw the price scale of your graph to
count out intervals of time in that average. And thus, if you have a daily
market graph and you discover that a stock price moves an average of three
points per day, you would then draw a new graph where each of these
three-point days on the X-axis would be coupled with a three-point unit of
movement in price on the Y-axis. Days one, two and three would square up
with prices three, six and nine, for example.
Once your charts are "squared" and redrawn, Gann revealed that it becomes
very easy to see that the graph will move in "radii vectors" of specific
lengths and specific directions. In a squared chart, the radii vectors will
all be the same visible length, contained within the perimeter of the simple
ellipse that is drawn around them. Each time that a radii vector reaches its
end, a new vector is formed that will have a different direction. (In
Cowan’s books there are techniques that eliminate the need to redraw or
square your charts, instead using the existing chart for reference- but in
these cases the price and time ratios are usually not squared, thus making
the similar lengths of the vectors harder to see.)
For most readers, the idea that an apparently random phenomenon such as the
movement of a stock’s price value in time could occur in specific, ordered
intervals and vectors seems far, far too simple to be true. However, Gann
proved his case with extensive documentation beyond any shadow of a doubt.
And thus, even though you can find Gann’s books in the library, many traders
are still selling copies of Gann’s Master Course for Stocks, a huge
compilation of Gann’s writings and lectures over many years, for absurdly
expensive prices. And people will buy them, just because of the promises of
profit that are hidden within them, if they can keep and study the books
long enough to understand how to do it. And here, we are really only
describing the absolute basics of this enormously complicated body of
information.
COWAN’S STOCK MARKET GEOMETRY
And now, enter Bradley Cowan, who may eventually be known on a very
widespread public level as the man who silently turned the entire field of
stock market analysis on its end at a very young age, and also made a
significant breakthrough in hyperdimensional harmonic physics. Little is
known about Cowan, as he refuses to give interviews, lectures or public
appearances, seeking rather to allow his books to speak for themselves.
There are two basic sets of books that Cowan has produced, namely
Four-Dimensional Stock Market Structures and Cycles and Market Science. This
author has not purchased either of these sets of rather expensive books yet,
as our knowledge of the specifics of Cowan’s information comes from
interviewing an increasing number of his clients on a professional basis.
Each of these clients were shocked to see this material given a rational,
causative explanation on our website, and thus immediately became interested
in obtaining their own dream readings. For them, there is no doubt that this
system works, as each of them continue to actively use these principles to
play the stock market and determine where it will go next.
Cowan does require that a non-disclosure agreement be signed in order to
purchase the second series of books, Market Science, which deal with issues
such as the soybean market, the musical fifth and the square of twelve,
(yes, that’s 144,) as defined on
Cowan’s website. This
author did not want to try to press any of his clients to tell him any
information from the second set, as this would be both illegal and damaging
to Cowan. The material within the first book does not require a
non-disclosure agreement, however, and our publication of the validity of
these concepts has already triggered waves of new interest in Cowan’s books
-- so the PR pays for itself. And indeed, more than half of our "Cowanite"
clients have already made significant profits from these techniques when we
spoke with them.
Now how does this relate to three-dimensional Platonic structures, you ask?
The bottom line is that Cowan simply observed the hidden geometric
structures that were formed when Gann’s radii vectors were compared against
each other. Over time, Cowan realized that these radii vectors on "squared"
stock market charts would assemble into the "unwrapped" faces of
three-dimensional Platonic solids, one face at a time. We remind ourselves
at this point that each side of a Platonic Solid is the same length, just
like each radius vector is the same length. Three out of five of the
Platonic solids are formed by equilateral triangles - the octahedron,
tetrahedron and icosahedron. (The cube has square faces, and the faces of
the dodecahedron are pentagonal, or five-sided.) All equilateral triangles
have 60-degree angles at each corner. And thus, when Cowan started to see
the endless redundancy of 60-degree angle relationships between radii
vectors, he knew that he had stumbled over something quite grandiose -
Stock
Market Geometry. And indeed, once it was seen for what it was, it became
very obvious that Gann had to have known about it, but simply kept it a
secret.
[When we look at the below diagram, we must remember that the ellipses that
we are seeing are actually flattened out into two dimensions -- and thus
this is not really an honest three-dimensional graphing of what this would
look like. It will, however, show us how one tetrahedral face would appear
on a perfectly "squared" two-dimensional graph.]
And so, once we throw Cowan’s work into the mix, we indeed expose how our
passage of time here in the third dimension is a truly multi-dimensional,
geometric phenomenon. This should be fully expected, since we can see these
same effects in space with
the Global Grid, and space and time are unified
in the sea of Conscious Aether. In his books, Cowan shows us how geometric
forms such as the tetrahedron, octahedron and cube reveal themselves in an
"unwrapped" form upon a two-dimensional stock market graph.
In case this is hard to visualize, we must remind ourselves of what Cowan is
fundamentally asking us to do. He is essentially telling us that the
movement of a stock, in terms of its radii vectors, forms a hidden
three-dimensional geometry. However, we do not have three-dimensional graphs
to illustrate this. Therefore, a two-dimensional stock market graph will be
a "flattened out" version of three-dimensional action. This could be
visualized by actually taking a piece of paper with your squared-out stock
market graph on it and then wrapping that paper around the model of a
tetrahedron, let’s say, whose sides are of equal length to each radius
vector on the stock graph. To your amazement, after wrapping that graph
around the tetrahedron, (and necessarily crumpling and folding the paper in
certain places to correct for the two-dimensional distortions that the paper
introduces,) you would indeed see how the graph itself would remarkably hug
the outline of the tetrahedron. All twelve clients agree that Cowan has
proven this in his first set of books over and over again, beyond any shadow
of a doubt, using real examples from the stock market.
Perhaps what is even more amazing than this is what the ellipses reveal to
us. The ellipses actually trace out the path of a spiral that forms the
geometric shape as it moves along. Yes, that’s right, a spiral -- the same
exact formation that is observed in our images of Cymatics from
Hans Jenny,
where the Platonic Solids emerged within the vibrations of a fluid,
connected by large interconnecting spirals.
Now, we see the same harmonic, spiraling, geometric passage of energy
occurring in the aetheric "fluid" of time, directly through the work of
Bradley Cowan. The ellipses that surround each of Gann’s ’radii vectors,’ or
each side of the Platonic Solid, would actually define those places where
the spiral is "buckling out" of the geometric shape as it continues its
rotating motion.
We should already recognize the below picture, derived from the very
well-known "Triple Julia Set" crop formation that appeared literally
overnight at Windmill Hill in England in 1997, as we have already printed it
before with a circle around it to illustrate its outer spherical field.
Again, this diagram helps us visualize how such a spiral, based on the
Julia
Set fractal, would formulate a tetrahedron. All straight lines and triangles
were not in the formation but rather drawn in afterwards, aligning with the
shape that the collection of spiraling circles suggested. Furthermore, if we
also inserted an inverted mirror-image of the crop formation over this same
diagram, we would observe the formation of ellipses that are literally
identical to those envisioned by Cowan and visually modeled in the
Cymatics
experiments of Dr. Jenny.
And if we briefly look back to the spatial distortions of
the Global Grid
again, as seen in our study of "Grid Circles," we can see circular,
unfolding "fractal" spirals in the formation of island chains and continent
borders. Furthermore, an overlay from the Stonehenge Julia Set formation in
1996 reveals almost the exact same fractal shape:
Since the ETs delineated the simple spirals as actually fractal formations,
we believe that this is showing us how there can be very large and very
small levels of Platonic solids that smoothly interconnect with each other.
This fits in perfectly from a quote of
Ra:
The term density is a, what you call, mathematical one. The closest analogy
is that of music, whereby after seven notes on your western type of scale,
if you will, the eighth note begins a new octave. Within your great octave
of existence which we share with you, there are seven octaves or densities.
Within each sub-density are seven sub-sub-densities. Within each
sub-sub-density, seven sub-sub-sub-densities and so on infinitely.
To see this effect occurring with fractals, the
Mandelbrot Set certainly
could be expanded into three dimensions just like Cowan has done with the
stock market graphs, thus revealing the spherical structure of the different aether densities within itself. And one of the most fundamental qualities of
any fractal is that it is composed of spiraling lines that will show the
same formations over and over again as you zoom in on them. These spirals
would naturally form the Platonic geometries within themselves as they
unfold, as the previous crop circle diagram suggests.
What we have learned from Cowan’s clients is that lower-order cycles will
show up in tetrahedra and octahedra, which in our system are the geometries
of the fourth and third densities or dimensions, respectively. However, far
longer-term cycles emerge as cubical formations in the market, which would
be those of the fifth density. Once again, Cowan shows that the longer-term
radii vectors of the graphs can be shown to trace a path over a rotating
cube over the course of many years. It would make sense that the cube would
take longer to show up than the lower-order shapes, as the cubical geometry
of the fifth dimension is of a far higher vibration than the tetrahedron of
the fourth.
Furthermore, Cowan teaches us that the four-way or "square" division of the
84-year orbital period of the planet Uranus precisely defines the time units
that form each side of this basic "market cube" as it unfolds! This is the
first big clue that we have to indicate that the orbits of the planets
themselves are tracing out these geometric forms in free space, forms which
have very active effects on the structure of spacetime as we perceive it.
And according to Cowan’s clients, a stock trader does not want to tangle
with this cube. Based on Cowan’s advanced calculations that combine price
and time as a whole, both the Crash of 1929 and 1987 could be predicted in
advance, practically down to the day, by this cubical structure. And as of
May 1999, the potential for the next major downward trend had begun, in
terms of geometry, though it has not been as steep as the others thus far --
but even as this book is going to print in April of 2000, the market is
experiencing jitters unprecedented since the Crash of 1987.
The last bit of information regarding Bradley Cowan’s works that we need to
mention at this time is why he calls these stock market cycles
"four-dimensional." The reason for this is that in three dimensions, you
cannot predict the future, merely study the past and observe the present.
However, by accurately deducing the structure and movement of these
higher-order geometries in advance, it is indeed possible to move outside of
linear time and predict the future with great accuracy. Therefore, since the
geometries indeed forecast events that have yet to occur, they can be
considered as fourth or even fifth-dimensional in their structure.
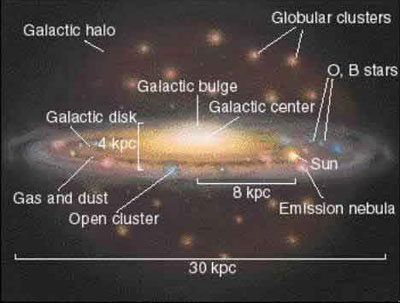
GALACTIC GEOMETRIES IN TIME: THE WILCOCK CONSTANT
One of Wilcock’s most significant original discoveries in "harmonic aether
physics" occurred when he happened to come across an astrophysics
professor’s webpage. He originally discovered this page in his search for
information on the interesting phenomenon of dark matter. The first
significant point that David noticed was that the entire galaxy is spinning
as a single unit, meaning that the outside portions travel at the same
relative speed as the inside portions, just like a single, connected disc.
Obviously this is not the case in our own Solar System, as in order for
Pluto to move at the same relative speed as Mercury, it would have to travel
at a tremendous velocity. Therefore, our current astrophysicists have
postulated that the only way that our Galaxy could spin in unison like this
would be if a sphere-shaped field of matter named the "Galactic Halo" exists
around it. However, since we cannot see this halo, they have called it "dark
matter" and insist that it must be there. And now, based on our
understandings of the harmonic aether, we can clearly see that this is
unnecessary - it is a simple property of the spherical harmonics of aether
vibration that is at work.
As David inspected this page, he came across a number that he had never
before been made aware of. In previous manuscript versions of this book, he
had alluded to the fact that there must be a comparable Galactic cycle to
what was seen in the Nineveh cycle. However, at the time he was unaware that
there were any numbers for the length of the Galactic rotation that were
precise enough to make any calculations. On the professor’s website the
number was clearly given: the galaxy rotates once approximately every
225,000,000 years.
David was immediately excited when he saw the number. The first thing that
he did was to see if this number could be turned into seconds and thus
derived in a similar way to the Nineveh Constant, from the "vibrations" of
seven and six. He calculated that there were a total of 31,556,926.08
seconds in a year by multiplying 86,400 per day times 365.2422 days. By
multiplying this number into the 225 million-year orbit of the Galaxy, he
could get a ballpark for exactly how many seconds this would be. Then, he
eventually realized that if he took 0.7, not 70, and multiplied it by 60
nine times in a row, he came up with a number that was very, very close - a
"harmonic" Galaxy orbit of exactly 7,054,387,200,000,000 (or roughly 7
quintillion) seconds in length. Once he had this number, he then simply had
to multiply it by 365.2422 to get the exact number of years that it would be
-- and thus a true "harmonic year" of the Galaxy became 223,544,814.9201
million years in length. The fact that .7 multiplied by 60 nine times in a
row could be 223.5 million, when the professor’s figure was set at 225
million, was already quite stunning. David knew that when small numbers are
multiplied into large numbers, each successive expansion in size would make
it more and more difficult to naturally arrive at such a close
correspondence by sheer chance. In other words, he was "on to something
big."
David took a deep breath as he realized the next step. In order to see if
everything worked out properly, he would have to take the exact length of
the Nineveh Constant in years and divide it into the "master harmonic
number" for the Galaxy. This was the moment of truth. If the resulting value
turned out to be non-harmonic, then there would be nothing left of the
theory -- the entire effort would have crumbled apart. David had clearly
seen what the true "harmonic" value of the Galaxy’s orbit was, and that it
was based again solely on the vibrations of seven and six -- so there was
reason to believe that it should amount to something. However, this didn’t
change the fact that David was nervous - if the calculator showed a
meaningless number, then he knew that the theory was either seriously flawed
or completely wrong. It was a moment that might never happen again in his
life the same way.
In order to get to the "moment of truth," he had to calculate
the Nineveh
Constant in years, by taking its total value of 2,268 million days and
dividing it by 365.2422. From this, the exact number of years in one Nineveh
Constant turned out to be precisely 6,209,578.192224, or roughly six million
years. Then, all that was left was to take this number and divide it by the
"harmonic" length of the Galaxy’s orbit, at 223,544,814.9201 years. By the
time David got to this point and had set up the final calculation, he had
already accepted that it probably wasn’t going to be anything significant.
He was ready for the letdown, ready to go back to the drawing board, ready
to start all over again from scratch. He was almost disappointed in himself
as he prepared to hit the ENTER key, waiting for the messy number to appear
on the screen. After all, anything but a messy number would be a complete
miracle.
He took a deep breath, closed his eyes, and pressed ENTER.
Click.
He opened his eyes.
In the window of the calculator shone two digits, and to
David’s eyes they
were as bright as the Sun.
36
David’s entire body went completely numb. Suddenly he burst out of the chair
and found himself screaming at the top of his lungs with joy, jumping,
shaking his arms and racing around the room- there could be no mistake. "Oh
my GOD, oh my GOD, oh my GOD, I can’t believe it! Thank you GOD!"
The Master
Harmonic Number, 36, had appeared right before his eyes as if by magic! It
was the Crown Jewel, the Holy Grail, the ultimate proof that the Harmonic
Universe Theory was real. David now knew that our planets come into a
perfect straight line exactly 36 times in a row for every rotation of the
galaxy. The majesty and harmony of the wheelwork of the Creation was
exposed. The answer was more beautiful, more elegant than David could have
ever possibly imagined. He almost couldn’t believe that he was the first one
on the planet to have discovered this.
When he finally came to his senses, he had to check the soon-to-be-named
Wilcock Constant against the value for the precession in
the Nineveh
Constant, which in this case turns out to be 25,873.2424676 years long,
fairly close to the 25,920-year "harmonic ideal" value. To his amazement,
the number was exactly 8640. In other words, everything worked exactly like
a clock. There are 3600 seconds in an hour and 86,400 seconds in a day.
Similarly, there are 36 Nineveh cycles and 8640 precessional cycles in a
"Galactic Year". Everything worked out -- just like a clock. Now, when he
went back to the Ra Material, he knew what they were talking about.
First,
the quote from Session 9:
Thus, each of your planetary entities is on a different cyclical schedule as
you might call it. The timing of these cycles is a measurement equal to a
portion of intelligent energy. This intelligent energy offers a type of
clock. The cycles move as precisely as a clock strikes your hour. Thus,
the
gateway from intelligent energy to intelligent infinity opens regardless of
circumstance on the striking of the hour.
Then, the quote from Session 13:
The spiraling energy, which is the characteristic of what you call "light,"
moves in a straight-line spiral thus giving spirals an inevitable vector
upwards to a more comprehensive beingness with regards to intelligent
infinity… The fourth density is, as we have said, as regularized in its
approach as the striking of a clock upon the hour. The space/time of your
solar system has enabled this planetary sphere to spiral into space/time of
a different vibrational configuration…
Then, the quote from Session 14:
Imagine, if you will, the many force fields of the Earth in their
geometrically precise web. Energies stream into the Earth planes, as you
would call them, from magnetically determined points… the various
geometrical centers of electromagnetic energy which surround and shape the
planetary sphere.
Then, the quote from Session 15:
Love creating light, becoming love / light, streams into the planetary
sphere according to the electromagnetic web of points or nexi of entrance.
These streamings are then available to the individual who, like the planet,
is a web of electromagnetic energy fields with points or nexi of entrance.
Here, David knew that they were speaking of the chakras. Earlier in this
same session, Ra had said the following:
The thought-form distortions of your peoples have caused the energy
streamings to enter the planetary magnetic atmosphere, if you would so term
this web of energy patterns, in such a way that the proper streamings are
not correctly imbued with balanced vibratory light / love from the, shall we
say, cosmic level of this octave of existence.
And then, the quote from Session 17:
The fourth density is a vibrational spectrum. Your time / space continuum
has spiraled your planetary sphere and your, what we would call galaxy, what
you call star, into this vibration. This will cause the planetary sphere
itself to electromagnetically realign its vortices of reception of the
in-streaming of cosmic forces expressing themselves as vibrational webs so
that the Earth thus be fourth-density magnetized, as you may call it…
And then, the case was sealed with the quote from Session 63, started by a
question from Dr. Elkins that seemed to pop "out of the blue:"
QUESTIONER: Is there a clock-like face, shall I say, associated with the
entire major galaxy so that as it revolves it carries all of these stars and
planetary systems from density to density? Is this how it works?
RA: I am Ra. You are perceptive. You may see a three-dimensional clock face
or spiral of endlessness which is planned by the Logos for this purpose.
At this point, the only remaining step was to find a reason for why
Ra
insisted that the key figure for our planetary evolution was three cycles of
precession, not one. David returned to the figures from Cotterell, and saw
that one full rotational cycle of the fortune cookie-shaped "neutral sheet"
surrounding the Sun had been calculated at 18,139 years. This was obviously
too big of a number to fit in together with 25,920 years, which would be
one precessional wobble of the Earth. David knew that three precessional cycles
added up to 77,760 years. Then, he realized that if Cotterell’s number was
increased from 18,139 years to 18,140, which is a perfectly possible and
excusable adjustment, then four of these cycles would add up to 72,560
years. And 77,760 minus 72,560 was 5200 -- again, the same "shift cycle"
seen on so many smaller levels with impressive redundancy, based on the
harmonics of the number 13. We remember that this even included the
difference between the number of J-S conjunctions in one Mayan Calendar as
opposed to their harmonic katun counterparts.
David then decided to see how many three-precessional cycles would occur in
one full harmonic rotation of the Galaxy. He was hardly surprised to see
that the number came out to 2880-- the exact harmonic of "double light" and
the first ratio in the common Diatonic scale. In short, everything that
Ra
had said about the essential structure, function and architecture of the
Universe was true -- and therefore, the actual harvest itself was also a
legitimate reality.
And then, David thought back to the remarkable internal timeline structure
of the Great Pyramid, which Ra had given to humanity as their greatest
blessing -- a structure believed to be the perfect form for initiation and
healing. And as he again studied the Timeline, he realized that the
remarkable metaphysical qualities of harmonic time and the Shift of the Ages
had been built-in all along…

|