|

We have now seen the existence of forces at the quantum level that produce
geometric structures, and which allow groups of atoms to merge together into
larger wholes where their individual identity is no longer detected. With
Rod Johnson and others’ discoveries, we have a unified quantum model to
explain the existence of these forces, tying together all the loose ends
that are currently known to exist in quantum theory, such as the meaning of
Planck’s constant. Our objective in this chapter will be to show that in a
truly Unified aetheric model, these energy formations should continue to
exhibit the same structure and behavior at all levels of size. We will begin
our discussion by looking at the research by Dr. Massimo Teodorani and
associates into the recurring phenomenon of “thermal plasma” formations in Hessdalen, Norway. We will then move into a review of information regarding
the Earth’s geometric grid of torsion-wave energy upwellings, most of which
was covered in chapter 11 of our previous volume.
5.1 EARTH PLASMA FORMATIONS
On November 17, 2001, researcher and radio personality
Linda Moulton Howe
published an exclusive report on the research of Dr. Massimo Teodorani and
associates regarding anomalous plasma formations that have been seen in the
valley of Hessdalen, Norway. Howe writes that through the last decade, many
eyewitnesses have observed and reported:
…flickering, pulsing lights that change shape. A couple of times in the
1990s, Norwegian engineers investigated the lights. But the research became
more serious this past August of 2001 when Italian astrophysicists joined
Norwegian engineers in a joint study with radar, photographs, videotape and
spectroscopes. The results can be broken down into two groups: 95% are
thermal plasmas and 5% are unidentified solid objects. The plasmas emit long
wave radio frequencies and strangely, their temperatures do not vary with
change in size or brightness.
Howe then goes on to quote from the summary of
Teodorani et al.’s research:
1. Most of the luminous
phenomenon is a thermal plasma
2. The light-balls are not single objects but are constituted of many small
components which are vibrating around a common barycenter
3.
The light-balls are able to eject smaller light-balls
4.
The light-balls change shape all the time
5. The luminosity increase of the light balls is due [only] to the increase
of the radiating area. But the cause, and the physical mechanism with which
radiation is emitted, is currently unknown
As we can see from the above list, we have a formation that has certain
characteristics in common with the microcluster; namely that we have a
series of “many small components” of spherical energy fields (such as the
atoms in a microcluster) that are “vibrating around a common barycenter.”
According to Dr. Erling Strand, these plasma formations could remain
visible
for up to two hours, which makes them decidedly different than the
short-lived phenomenon of ball lightning. As Dr. Teodorani reports,
… when we process the data we see that many small light balls vibrate around
a common barycenter. So it is something like a center force that is ejecting
balls or the mini-balls are going around the center body. It is quite
complicated.
The next quote establishes a fact not seen in Dmitriev et al.’s research on
natural self-luminous formations, but which aligns precisely with the idea
that these plasma formations can behave according to the same fundamental
geometric principles as the microclusters, albeit on a larger level of size.
We will quote Dr. Teodorani as “MT:” and Linda Moulton Howe as “LMH:” in
this excerpt, with emphasis added:
MT: And we also saw during the processing phase that these plasmas are able
to assume several shapes. Sometimes, also geometric.
LMH: Also geometric shapes?
MT: Yes. Sometimes also geometric. We don’t know the reason about that yet,
but we saw something that was like a rectangle. It suddenly changes from an
amorphous plasma to a rectangle. It happened transiently and we saw it and
it is in my paper, EMBLA 2001: The Optical Mission.
LMH: So you were watching something round like a sphere of plasma and it
suddenly transformed into a rectangle?
MT: Absolutely. At first we thought it was a sort of instrumental effect due
to the video camera. But after we compared the photo of this same phenomenon
with the video of the same phenomenon, we saw that they were the same thing
– that is, a plasma – in spite of that geometrical shape, because we can do
certain analyses by studying the distribution of light, and also by taking
the spectra. We see that one is a plasma. So, it is strange – a
plasma
phenomenon that we can describe, but not yet tell what is the main reason
that is causing it.
LMH: And is it fair to say that none of you or any other astrophysicists
have ever documented this kind of plasma interaction and transformation
before now?
MT: No (we haven’t)… I know that some astrophysicists have seen the light
phenomenon as amorphous light balls, but it is the first time that we saw
that this year.
LMH: And you have concluded in your scientific paper that these are thermal
plasmas because why?
MT: Because if I take a spectrum and I plot the spectrum in a flux
wavelength, that spectrum resembles the typical Max Planck curve which is
typical of a cocktail of ions and electrons. That speaks very clearly. And
we can also measure the temperature and the temperature was in that case a
little bit higher than the solar temperature; 6,500 Kelvin degrees.
The picture of this formation is featured in Howe’s online article, and a
clear geometric shape is visible; remember that it was captured both on
conventional film as well as videotape. From here on in the interview, Dr. Teodorani tells us that these plasmas could suddenly change in size without
any change in their measured temperature, which is certainly an anomaly in
the view of conventional physics. In our model, we see that as the size of
the plasma decreases, the missing energy is displaced into a higher density
of aetheric energy. It is for this reason that the temperature of the plasma
does not change; some of the plasma has simply moved out of our own aetheric
density of matter. It can still be detected by certain instruments such as
radar, though, just not by our sensory organs.
Furthermore, Teodorani’s associate Prof. Erling Strand has captured about 34
radio tracks of plasma phenomena that would alternate between visibility and
invisibility. A radar would indicate the position and velocity of the
plasma, but the naked eye could not detect its presence, and the switches
between visibility and invisibility could be nearly instantaneous. This
sudden change in visibility only adds to the evidence that the energy of the
plasma is displacing into a higher density of aetheric energy when it
becomes invisible. Preliminary evidence indicates that the plasma suddenly
drops in temperature to 100 degrees Kelvin or less as it disappears, all of
which can occur in less than one second. [6] Such rapid temperature changes
obviously do not obey conventional rules of thermodynamics – the plasma is
“there one minute and gone the next.”
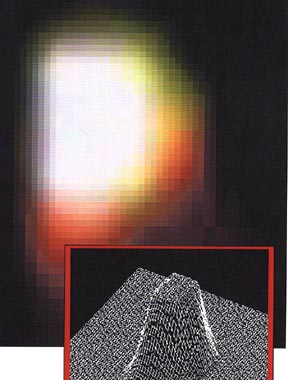
Figure 5.1 - An enlarged picture of the rectangular plasma formation after
changing from a sphere,
as well as the corresponding 3-D Point Spread Function (PSF) that is used in
order
to simultaneously obtain the peak intensity and the apparent dimension, in
pixels,
of the target. Date: August 18, 2001. Image processing by M. Teodorani.
In her interview with Dr. Teodorani, Linda Moulton Howe adds further support
to the connection between plasma spheres, invisibility and geometric
structures, as she reports her own experience with a plasma formation in
England that was only visible through an infrared scope:
LMH: And that is so consistent with at least twelve years of eyewitness
accounts in England, myself included, in which through an infrared scope I
have been able to see what looked like an oval of light change into a square
of light that was pulsing. I saw this along with other people and we could
only see this in the infrared scope; we could not see it with our eyes.
[emphasis added]
As reported in Chapter 11 of Richard Pasichnyk’s book The Vital Vastness,
Volume One, such plasma formations are almost always associated with some
form of enhanced geophysical activity. One of the most anomalous single
events of this type was reported on November 30, 1930 in Tango,
Japan, and
we have added a note after the first sentence:
It was a clear, cloudless morning sky when a
strange rainbow appeared,
attracting attention. [Note: this rainbow appears to have been caused by a
local distortion of the aetheric energy field in that area, thus causing
visible light to break up into a spectrum.] Being out of season and unlike
anything ever seen before, that unique occurrence wedged its way into the
memories of many. As the next morning progressed, with it came the rumbling
and quaking of the ground. In the eyes of awestruck faces one could see
reflections of flashes of light, bluish flames and aurora-like afterglows
that painted the heavens. Where the ground shook most, there came
bewildering bright beams, fireballs, funnel-shaped lights and moving
luminous columns. Toward Manpukuzi Temple, a straight row of radiant round
masses revolving with considerable splendor could be seen. [emphasis added]
Such events are not as uncommon as most people would believe; they simply
are not collected and reported with the same degree of unbiased presentation
that is typical of more conventional forms of scientific data. Both Pasichnyk and
Dr. Aleskey Dmitriev cite studies that indicate definite
increases in the numbers of reported “UFO” sightings during times of
enhanced geophysical activity. Pasichnyk points out a 1977 book by
M.A. Persinger and G.F. Lafreneiere that graphed a combination of
earthquakes and UFO reports on maps of the US between the years 1820 and 1971, and both
phenomena are seen to “coincide quite well” in the same areas at the same
times. [9] Hence, clear evidence points to the fact that these energetic
plasmas are emanating directly from the center of the Earth, such as in the
case of an earthquake, and are therefore made of the same material that the
Earth’s core is made out of. Thus, we stand with Pasichnyk in asserting that
the center of the Earth is composed of the same form of energetic plasma
that we see in the Sun – and this would explain why Teodorani et al.’s
measurements showed that the plasma had the same temperature as the Sun’s
surface.
In the following two chapters, we will present evidence that the planets are
actually ejected matter from the Sun, and therefore composed of the same
basic substance as the Sun itself. Indeed, in a unified aetheric cosmology,
all matter originates as a form of superconducting Bose-Einstein condensate
plasma with geometric properties, as discussed in previous chapters, before
cooling, separating and crystallizing into individual atoms and molecules.
5.2 PROOF FOR EARTH’S LUMINOUS PLASMA CORE
Most of the case for the Earth’s plasma core was presented in our previous
volume, but we shall repeat many of the key facts here again due to their
importance. Most educated people are aware that the hottest area of the
Earth is in the core, and that it gradually cools down through successive
stages of the layer known as the mantle before finally arriving at the
coolest area on the outside of the sphere, which is the hard crust or lithospheric stage. It is also important to remember that the
Earth’s outer
crust is so thin compared to the rest of the Earth’s mass that if the Earth
were reduced to the size of a glass of water, the crust would only be as
thick and as dense as the surface tension at the top of the water itself.
This shows how little “solid” matter there actually is on the Earth.
Conventional geologists believe that the Earth’s core is composed of iron
and nickel. In the prevailing “dynamo” theory, this metallic core rotates
inside the Earth and in turn creates the Earth’s magnetic field. Arguably,
the strongest reason for the popularity of this theory is the belief that
one requires a piece of metal such as iron in order to conduct a magnetic
field. However, numerous researchers including Schappeller, Searl and
Roschin & Godin have demonstrated in the laboratory that a
magnetic field
can be created as a standing-wave of glowing aetheric plasma energy, nothing
more.
Indeed, all our forms of “proof” for what lies in the center of the Earth
are indirect, brought about primarily through research on the seismic
impulses that are created during earthquakes. As explained in the previous
volume, waves traveling side to side, known as S-waves or transverse waves,
cannot pass through the Earth’s core, and this is what one would expect if
the core were solid. Pasichnyk points out that S-waves also could not travel
through the Earth’s core if it were made of compressed plasma energy.
Such plasma models would normally be shot down immediately, as conventional
science thinks of the Earth as an inert mass, and immediately rejects the
idea of a plasma core because such an energy source would require a
continual energy input. However, once we understand that both gravitation
and torsion-waves are forms of aetheric energy continually instreaming into
the Earth, we have a source of energy that can effortlessly pass through
physical matter and replenish the plasma source in the Earth’s core. A
majority of this torsion-wave energetic activity occurs at the poles of the
Earth, in alignment with the magnetic field. We remember from Chapter One
that Kozyrev found the greatest torsion-field effects near the North Pole,
and Pasichnyk has also provided us with several other forms of proof. For
example,
Earthquake waves travel faster along the north-south axis of the Earth’s
interior than they do on any east- west axis.
As discussed in the previous volume, other observations also point to the
fact that energetic activity is indeed accelerating into the Earth’s core
from the polar regions:
1. Auroral activity associated with magnetism and solar activity. The aurora
borealis, or “Northern Lights,” is a luminous energy formation usually seen
over the poles. When the Sun’s activity increases, the aurora becomes
brighter, and the aurora also varies in direct proportion with the Earth’s
magnetic field. This aurora shows us the instreaming energy in action.
2. Curtain-shaped auroras at the poles. From studying the formations of the
aurora, we also know that a helix-shaped vortex of energetic electrons and
protons, like a super-elongated funnel, has been seen to spiral down into
the polar regions of the Earth at a high level of intensity.
3.
Earth’s core is too hot for metallic magnetism. Metals cannot maintain a
magnetic field above a certain crucial temperature, known as the Curie
point. However, contrary to the conventional models, the temperatures inside
the Earth were found to rise very quickly as we drill down, and if we
continue this smooth increase along by extrapolating it on a graph, then at
only 100 kilometers or 62 miles, the temperatures in the Earth would be too
high for metals to conduct a magnetic field.
4. Eclipse anomalies of magnetism and gravity. During an eclipse, the
earth’s magnetic fields are weakened, and this effect is significant enough
to confuse migrating birds. The gravitational field is also altered during
an eclipse, as seen in various pendulum studies. Both of these observations
show that the Earth is being continually ‘fed’ by the Sun’s torsion-field
radiation and instreaming energetic ‘particles’.
5.
Tilt of Earth’s magnetic field. If the Earth’s core were a
spinning
metallic dynamo, then we would expect that its magnetic field should be
aligned with its axis of rotation. However, since the magnetic field is
approximately eleven degrees offset from the rotational axis, the dynamo
model is not adequate.
6. Changes of the length of the day with solar activity. The length of day
(LOD) on the Earth is a measure of how fast the Earth is rotating. Clear
correlations have been established to show a connection between the LOD and
the level of solar activity. This shows a direct energetic interaction
between the Sun and the Earth that the dynamo model cannot account for.
7. Changes in magnetism with solar activity. Solar activity also can change
the direction and intensity of the Earth’s magnetic fields. It is highly
unlikely that a gigantic dynamo inside the Earth would be affected by such
outward changes.
8. Polar reversals, wanders and jerks. The Earth’s magnetic field has a
series of movements that the dynamo model cannot account for. Circular
patterns known as “Chandler’s Wobble” are continually traced at the poles,
and the magnetic field can experience sudden “jerks” as well as complete
reversals of polarity. A free-flowing energy source in the center of the
Earth, responsive to the Sun’s changes, far more easily accounts for these
anomalies than the idea that the Earth’s core is a solid chunk of metal.
9. Gravity’s role as a formative force. In our model,
gravity is the
movement of aetheric energy into the Earth that is creating matter and
energy within it each moment. Once we go deeper than 2,700 kilometers or
1,678 miles, there is a greater degree of gravitational force directed away
from the center than there is towards the center. This shows gravity’s role
in the formation of the Earth’s core, similar to how the Biefield-Brown
effect shows that the negative electron clouds rush towards the
positively-charged nucleus. Once the instreaming energy converges at the
center of the Earth, some of it pours back outwards, creating this
gravitational anomaly.
10. Plasma wind coming up from the Earth.
NASA’s Dynamics Explorer space
probe determined that a plasma wind emanates away from the Earth’s poles in
addition to the wind streaming into the poles. This demonstrates the quality
of both energy entrance and exit that is occurring in these areas, which
will be covered more deeply in ensuing chapters.
5.3 WILCOCK’S AETHERIC EARTHQUAKE MODEL
Based on all of the above evidence, we can clearly see that there is a
remarkable parallel between the aetheric model of the atom as a spherical torus and
large-scale plasma formations such as the Earth’s core. As
Pasichnyk and many others have documented, increases in Solar activity are
strongly correlated with increases in the amount and intensity of
earthquakes on the Earth. Once these earthquakes occur, anomalous plasma
formations are often observed as well. Further support to this concept is
seen in the phenomenon of “radar angels”, where radar operators would
frequently pick up false signals over geophysically-active areas of the
Earth. Most radars are now equipped to screen out these signals, which
appear to be caused by mostly invisible plasma spheres that are continually
ejecting from the Earth in seismically-active regions.
So then, what exactly is an earthquake? We present the following as an
informed supposition, based on the evidence presented throughout this book:
- We begin with a sudden surge of energetic activity, such as could occur
from solar flares or other sources that we will discuss later.
- This surge abruptly increases the amount of energy streaming into the
core
of the Earth.
- The total amount of luminous plasma in the core then increases.
- However, there is no decrease in the pressure from the Earth surrounding
and containing the plasma, so the extra energy has nowhere to go except to
be compressed under a higher amount of pressure.
- Based on simple aetheric physics, if the energy surge is high enough, then
this sudden pressure increase forces some of the plasma to displace into a
higher density of aetheric energy.
- Once the plasma reaches a higher density, it can easily pass through the
lower-density physical matter making up the form of the Earth that we now
know and measure.
- At this point, the plasma is no longer contained by the massive
compressing forces in the center of the Earth, but is free to move away from
the Earth’s center via centrifugal force.
- Now, in this higher-density state, the plasma bubbles up towards the
surface of the Earth, much as oil will bubble up to the top of water.
- Since pressure always flows from high to low, the plasma will naturally
move towards the area of lowest aetheric energy density near the surface of
the Earth.
- “Empty” vacuum space is much less dense than solid matter, and therefore
has a much lower density of aetheric energy.
- Therefore, a relatively vacuum-sealed crack in the Earth’s crust has
less aetheric energy density than the surrounding solid matter.
- The displaced plasma is naturally attracted into such cracks.
- Once the plasma reaches this space, pressure is relieved, and some of it
displaces back down into its original plasma state that it held in the
Earth’s core.
- However, since the temperature is now much lower, some of the plasma
suddenly cools off.
- As the plasma suddenly cools, it crystallizes into new physical matter.
- This new matter forms quite suddenly along the edges of the crack.
- Remember that when water crystallizes into ice, it expands in size.
Similarly, the volume of the plasma increases as it cools down (phase
shifts) into physical matter.
- Great explosive force can be released as this new matter is created, since
it pushes apart the surrounding landmass at the site of the crack.
- An earthquake is created as this occurs if the amount of new matter is
large enough to cause a slippage along the fault line.
- In many cases, some of the plasma remains in a higher density state, and
continues to pass out through the surface of the Earth.
- As this energy passes through the atmosphere, it may or may not shift down
into a low enough density to become visible.
- If the plasma remains at a higher density, invisible “radar angels” are
formed.
- If the plasma shifts back to its original density, “plasma formations” may
be detected.
- If the plasma is in a reverberating, “wobbling” state, it may
lapse
between visibility and invisibility, moving in and out of two adjacent
levels of aetheric density, as Prof. Ehrling Strand observed and filmed in
Norway.
Certainly, the more conventional models of
earthquake formation and the
pressure of surface movements should still factor in as well; this is just a
factor that can create more sudden changes. This new model also helps to
explain the phenomenon of “kimberlite pipes,” mentioned both by Dr. Dmitriev
and Dr. V.L. Dyatlov. This phenomenon is considered in Russia to be “the
great mystery of modern geology,” and it has been primarily observed in
Alaska. First, seismologists detect a sudden explosion and heat surge near
the Earth’s surface. If the area where the explosion occurred is close
enough to the surface, it can be drilled into and examined. [In some cases,
the Eskimo people have been able to hand-dig their way down to the site
itself.] An elongated hollow tube is discovered in the crust at the site of
the explosion. Even more interestingly, and profitably, the inside of the
tube is completely lined with diamonds!
Normally it is believed that diamonds and other such crystals take untold
thousands of years to be created, yet in these cases they appear to have
formed instantaneously. This will make even more sense to us in Chapter 10
when we study the work of Dr. Krasnoholovets and others, who found that
torsion fields naturally create greater hardness and crystallization in any
matter that they are exposed to. Metals that are exposed to
torsion-wave-generating devices will become significantly harder and more
crystallized in their form, and torsion fields can also create microcluster
formations in water and other compounds. Hence, a plasma formation contains
a very high intensity of torsion fields, ready to compress into geometric
crystals at a moment’s notice.
The astute reader should realize that there is another consequence to this
earthquake model. In this model, when there is a sudden surge of energy
increase in the Earth, the plasma is forced into a higher density and
escapes from the core. This in turn creates an earthquake, wherein new
matter is created. However, it is also possible that if the energy increases
in the core occur more slowly and regularly, then the entire size of the
core itself could gradually expand without displacing into a higher density.
This, in turn, would increase the overall size of the Earth itself.
This certainly fits with the quantum model that we have proposed in the
preceding chapters, since we have seen with microclusters,
quasicrystals and
Bose-Einstein condensates that atoms can group together into larger clusters
that retain a singular identity. The key here is that when enough energy is
added to these structures, they will continue to expand in size. Microclusters start out as individual atoms that then “melt” together into
larger, crystalline formations. Quasi-crystals can be grown just like any
other crystals over time, and yet they continue to maintain their uniquely
holographic and Unified structure, which cannot occur if the atoms are
maintaining an individual identity. A Bose-Einstein condensate
(superconductor) can also be expanded in size by the addition of new energy,
though it will continue to behave as if it were a single atom. In our model,
all basic structures at all levels of size in the Universe behave according
to these same energetic principles, and are capable of expanding as greater
amounts of energy stream in.
So therefore, the Earth should be capable of continually growing in size as
the core is continually replenished by new aetheric energy, much as would
occur in the growth of an organism. This prediction is realized in the
science of “Global Expansion Tectonics.”
5.4 GLOBAL EXPANSION TECTONICS
In 1933, Christopher Otto Hilgenberg was the first to show that if we shrink
the Earth down to 55-60 percent of its current size, then all the continents
would fit together just like a jigsaw puzzle, as seen in Figure 5.2. He made
the bold suggestion that this was caused by the Earth expanding in size; at
one time in the past, it really was 55 to 60 percent of its current size.
The most rigorous article that we have found on this topic is by James Maxlow [7], and shall be quoted as we proceed.
This new model is certainly not in today’s college textbooks, but it has
been quietly gaining in popularity over the years. An Expanding Earth
Symposium was held in Sydney, Australia in 1981, and the Smithsonian
Institution hosted a discussion meeting in 1989 where these concepts and
others relating to global tectonic models were discussed. As Maxlow writes,
These arguments [at the Smithsonian meeting] indicated that there seems to
be something questionable with the plate tectonic theory as it is currently
presented (Kremp, 1992,) and that present concepts of plate tectonics /
continental drift / polar wandering may need to be re-evaluated, revised or
rejected (Smiley, 1992.)
Figure 5.2 – Hilgenberg’s “terrella” models of the expanding earth. Smallest
globe is 60% of current radius. (From Vogel, 1983)
The “plate tectonics” or “continental drift” model is currently in vogue
among mainstream scientists. In this model, the Earth has maintained a
constant size throughout its entire lifespan, and the continents all
originated as one giant mass known as “Pangaea”. Eventually, this continent
cracked into several pieces, and the cracks were sites of volcanic activity.
As the new lava was ejected along these volcanic ridges and subsequently
cooled by the oceans, the different pieces of the original continent were
slowly pushed away from each other into their current positions.
However, in order for this “drift” to occur on an Earth
of unchanging size,
“what goes up must come down.” In more scientific terms, if there are areas
of “orogenic uplift” where new crust is continually being formed, then there
must also be “subduction zones” where the Earth’s crust is sinking back down
into the mantle and again melting into a molten state. As Maxlow indicates,
this model has a major, major flaw:
No definitive evidence for “subduction zones” has ever been found on
Earth.
Furthermore,
The areas where subduction zones even might exist are far fewer than the
Plate Tectonics model requires.
Or, to put it more simply,
We can easily demonstrate the Earth’s expansion with the observed data, but
we have no means of proving that the alleged subduction is occurring at the
same time.
Maxlow continues by mentioning that the conclusions of the “plate tectonics”
model were based on an incomplete set of data:
In presenting Global Expansion Tectonics it must be realized that the
global, geological and geophysical database has only now [2001] reached the
stage where any global tectonic hypotheses can be confidently quantified,
challenged, and / or discarded.
With the new data in hand, the “plate tectonics” model can now be discarded.
However, according to Maxlow and other sources, there are two main reasons
for why the mainstream scientific and geological community does not accept
an Earth Expansion Theory:
-
Matter is not “supposed to” be able to expand in our current understandings
of quantum physics
-
The evidence needed to create a mathematical model that can accurately
reproduce an Earth expansion process over time does not appear to exist
The first point is effectively eliminated by the quantum models that we have
discussed in this book, and Maxlow has provided the supportive evidence
required for the second point. As more and more information about the
geophysics of the Earth is acquired, the Earth Expansion theory is only
further enhanced in its credibility. New maps of the patterns, speeds and
directions of the spreading of the seafloor areas shows that the earth is
“undergoing an exponential expansion from the Archean [period] to the
present…”, according to Maxlow, and the maps and images to support these
conclusions are presented in his paper.
Based on Maxlow’s mathematical models, the Earth should be expanding in size
at a rate of approximately 21 millimeters per year. And indeed,
-
Carey in 1986 used satellite laser ranging measurements to calculate that
the Earth’s radius was expanding by 24 millimeters per year, plus or minus
eight millimeters.
-
Robaudo and Harrison in 1993 used VLBI and SLR geodetic measurements to
conclude that the Earth was expanding at 18 millimeters per year.
The conventional explanation for this observed expansion of the
Earth is
that it is caused by the continual influx of dust and meteorites, but it
also fits perfectly with Maxlow’s calculations based on straightforward
data-gathering from ocean seafloor spreading. Other scientists in Russia
have concluded that the Earth makes sudden increases in its size at certain
times in our geological history, and this could account for why Robaudo and
Harrison only observed an 18-millimeter-per-year expansion instead of
Maxlow’s calculated value of 21 millimeters.
The next obvious problem that this model raises is this: if all the
continents were once part of a single outer surface of the Earth, then where
do we put the oceans? Maxlow suggests that in these early days, there was
less overall water on the surface of the Earth, and “shallow epi-continental
seas” had formed across various areas of what are now the continents. The
original crust on the Earth had reached a certain level of thickness,
(probably as a result of cooling down from a molten state as it drifted away
from the Sun,) but then as the Earth continued expanding, the newly forming
crust was much thinner, and thus lower in height. As the continents began
breaking apart, these epi-continental seas emptied out into the
lower-elevation cracks, forming early versions of our oceans.
This raises another question: “Where did all the water in our oceans come
from if it wasn’t all originally there?” The Earth “grows” in size by the
continual increases in the aetheric energy it is receiving from the
Sun and
other sources. The same energetic processes that increase the size of the
Earth are also continuously creating new molecules such as hydrogen and
oxygen in our atmosphere, thus thickening it in density. Hydrogen and oxygen
then bond together to form greater quantities of water, which rain down from
the skies into the oceans, mixing with the salts in the Earth’s crust.
Interestingly, as we documented in the previous volume, the gas planets all
have been observed to have Earth-sized rocky cores, so it seems plausible
that the Earth will also eventually become a gas planet as it drifts farther
away from the Sun. In Chapter Eight we shall survey evidence from
Dr. Aleskey Dmitriev that demonstrates that this creation of new atmosphere is
an ongoing process, as new changes are being discovered in the atmospheres
of the Earth and other planets such as Mars.
5.5 RADIAL, GEOMETRIC EXPANSION OF THE CONTINENTS
If the activity of the Earth is to share a common bond with the activity at
the quantum level, then we should expect to see Platonic Solid geometry
involved during the process of expansion, just as we see in the formation of
a microcluster or quasi-crystal. We have already seen
Dr. Teodorani et al’s
observations of plasma formations in Norway adopting spontaneous geometric
configurations, and this suggests that the plasma in the Earth’s core must
also have the same properties. Furthermore, thanks to Pasichnyk’s detective
work, we know that W.R. Corliss, A.M. Dziewonski and J.H. Woodhouse have
confirmed that the Earth’s core displays “hexagonal symmetry,” meaning that
it is in the form of a three-dimensional geometric solid which has six sides
when seen from certain angles. In his 1996 videotaped presentation,
Gregg
Braden indicates that this symmetry data suggests that the Earth’s core is
shaped as a perfect dodecahedron, one of the five main Platonic Solids with
twelve pentagonal faces. Thus, the “microcluster” phenomenon of geometry
continues to hold true at much larger levels of size than just the quantum
realm. (An icosahedron also has very repetitive hexagonal symmetry.)
Let us not forget that geometry is the simple byproduct of vibration /
pulsation in a fluidlike medium; Dr. Hans Jenny’s studies revealed that as
the level of vibration / pulsation is increased in a fluid, the geometric
forms that we see inside the fluid become more complex. So, if the rate of
vibration / pulsation in the Earth’s luminous core is continually
increasing, then we should expect to see increasingly complex forms of
geometry at work.
Bearing this in mind, in 1993, Vogel et al. came up with the following
conclusions regarding the Earth Expansion Hypothesis, based on their
extensive modeling of the Earth’s surface. If you reduce the Earth’s radius
to 55 to 60 percent of its present size, then:
1. The continental outlines can be fitted together to form a closed crust;
2. The positions of the different continents with respect to each other
remain generally constant, with their separation caused by a “radial
expansion of the Earth” and;
3. The cause of the movements of continents resulted from an accelerating
increase in radius with time, in accordance with sea-floor spreading…
An accordance of these three phenomena cannot be accidental, [but are due
to] processes operating from within the interior of the Earth, resulting in
Earth expansion.
The key that we need to see here is in point number 2, where Vogel et al.
state that the separation of the continents occurs in a “radial” or
spiraling movement. Part of this model can be seen in Figure 5.3, based on
Perry’s computer reconstruction of the Earth’s radial expansion. When we
study the hierarchical structure of the Platonic Solids once “nested” inside
of each other, we see that there is always a spiraling movement as a
less-complex form expands into one of greater complexity. This has been well
covered in our previous volumes.
Figure 5.3 – Perry’s computer reconstruction of the radial expansion of the
earth. (From Carey, 1986)
Dr. Athelstan Spilhaus, an established scientist working for the
National
Oceanic and Atmospheric Association or NOAA, provided us with the proof that
the Earth is indeed expanding into greater and greater forms of geometric
harmony. According to our communications with Dr. Bethe Hagens, Dr. Spilhaus’ findings in this area were featured in Scientific American
magazine in the 1980s, and we are hoping to obtain a copy of the remaining
images from that issue. In Spilhaus’ model, the Earth is not expanding in
size, but the underlying geometric formations that he discovered can still
be directly applied to an expanding earth model, as all of his data is based
on straight lines with consistent angular relationships. Much like an
expanding microcluster, the hierarchy of forms that the Earth has
experienced are as follows:
-
Tetrahedron: When the “continent” of
Pangaea first broke up, each major
‘crack’ was almost exactly the same length, or ‘equidistant’ to every other
crack. These equidistant lines form the outline of a tetrahedron as the
continents then radiate away from their original center. As we discussed in
both previous volumes, this form continues to exert an energetic ‘signature’
on the Earth, and the work of Richard Hoagland and
The Enterprise Mission
has clearly demonstrated tetrahedral energy formations on other planets.
-
Cub-octahedron: As the continents continue to separate, their geometry
expands into a greater complexity of equidistant lines, forming the combined
shape of the cube and octahedron. As we wrote in
The Shift of the Ages,
Bruce Cathie has clearly demonstrated that this grid is also still active on
the Earth. From these precise Grid measurements, Cathie made many
breakthroughs in this new field of “harmonic aether physics” that are very
useful, some of which have been given in Shift of the Ages.
-
Icosa-dodecahedron: The Earth’s continents have now expanded into the form
of a combined icosahedron and dodecahedron of equidistant lines. Once more,
the process of expansion into this stage occurs along spiraling, radial
pathways.
In Figure 5.4, courtesy of the original NOAA paper, we can see
Dr. Spilhaus’
final stage of Earth’s geometric expansion as it now stands today. The
main
pentagon-shaped face that we see would be from the dodecahedron, and the
triangular faces would be from the icosahedron. Obviously the dotted lines
represent undersea ridges and/or mountain ranges. It is not surprising to
see this formation, considering that the Earth’s core appears to now be in
the shape of a dodecahedron:
Figure 5.4 – Dr. Spilhaus’ final geometric expansion of Earth’s continents,
courtesy his NOAA paper.
"Click" on image to see
Multimedia
Though Spilhaus’ data is quite satisfactory, there is a great deal of
additional information to support the idea that such geometric forms now
encircle the Earth. The Russian team of Goncharov, Morozov and
Makarov
independently determined that the Earth had the form of an icosa-dodeca
grid, [Fig. 5.5] based on the positions of the continents and undersea
volcanic ridges. The Mid-Atlantic Ridge runs precisely along with the zig-zagging vertical line in the Atlantic, as seen in the diagram. Both the pentagons of the dodecahedron and the triangles of the
icosahedron can be
seen in this image:
Figure 5.5 – Goncharov, Morozov and Makarov’s icosa-dodeca grid.
Interestingly, Goncharov et al. surveyed the locations of over 4000
different
ancient sacred sites on the Earth, such as standing stones,
pyramids, monoliths, menhirs, obelisks, temples, pagodas, stone cellars,
stone circles, ziggurats, earth mounds and the like, and without exception,
every single ancient site they surveyed was situated somewhere on this icosa-dodeca grid. We will learn why the ancients would have used such a
technology in Chapter 9; it is related to the ability of a formation such as
a pyramid to harness torsion waves for use in balancing the Earth. We will
see Russian and Ukranian research from esteemed sources that has proven that
pyramids can decrease the severity of earthquakes, severe weather and
radioactive emissions, while increasing the purity of water, underground oil
and minerals. Pyramids can also be used for healing, growth stimulation and
consciousness expansion related to spiritual growth.
All of the above results on physical matter are created by the action of
torsion waves, whose gentle pressure can create significant effects on
matter when in a sufficiently concentrated form, and it is important to
remember that these “grid lines” are primarily torsion-wave formations.
Torsion-field detectors will pick up a much stronger amount of torsion
radiation along these lines than they will in other areas, and the node
points where the lines cross are especially active. Thus, we may very well
want to rebuild such a pyramid system across the Earth once again in order
to offset the current damages that civilization is now producing. In the
event of a limited nuclear exchange and / or further environmental
destruction, such a project will become eminently necessary, as it was after
the fall of the lost ancient civilizations of
Atlantis and
Rama.
5.6 COUNTER-ROTATING ENERGY FIELDS AND GRID DYNAMICS
We remember that in Johnson’s quantum model, the atom is actually composed
of counter-rotating energy fields. In order for an atom or molecule to
become stable, the geometry must mesh together into a balanced formation.
Similarly, we can see in the final two stages of Dr. Spilhaus’ model of the
Earth’s expansion that there are always two geometries involved; we have the
combination cube and octahedron and the combination
icosahedron and
dodecahedron. Even the original stage of the Earth’s expansion, which
involved the tetrahedron, may have actually incorporated the octahedron as
well, since the octahedron is directly infolded within the
tetrahedron, as
we saw in the last chapter.
Based on Johnson’s model, it appears that the icosahedron and
dodecahedron
seen in
the Grid are indeed opposing energetic fields that have reached a
state of bonded harmony, in the exact same fashion as a molecular compound
is created in the quantum realm. We believe that the stress created by these
counter-rotating energy forces is the real cause for the Earth’s
counter-clockwise rotation on its axis. In this case, while the two
geometric forms are bonded together, the geometry rotating counter-clockwise
has a slightly stronger rotational force than the geometry rotating
clockwise, and this causes the Earth to rotate in a counter-clockwise
direction.
So, the available evidence suggests that the Earth indeed has a global
energetic grid that was well understood and utilized by ancient
civilizations. The key fact that we will explore in the rest of this section
involves the phenomena that occur along the lines and nodes of this grid.
Though this information is not popularly known, it is nevertheless very
real, and extensively documented in our previous volumes and several other
sources. For starters, we shall focus on the twelve equidistant points
(vertices) of the icosahedron as now seen on the Earth’s surface, and bring
in a list of anomalous properties compiled from the work of Richard Pasichnyk. Again, this material was featured in the previous volume, but it
is worthy of repetition at this point. We should remember here that
Pasichnyk refers to these twelve areas as “the Fields”:
1. Terrestrial electricity spirals, strange sounds, and magnetic and gravity
anomalies occur in each [area.]
2. The deepest parts of the ocean floor [are at these points.]
3. [The] ocean current patterns [flow around these points.] [Note: The data
of Ivan P. Sanderson reveals that these current patterns show
counter-rotational movement.]
4. Strong storms deep on the ocean floor [are seen at these points.]
5. Some of the highest values of ocean surface salinity [are seen at these
points.]
6. The most plentiful locations for bursting bubbles, producing stronger
atmospheric charge and other associations [are seen at these points.]
7. These same areas are high and low pressure systems in weather and storm
centers.
8. Spiraling gaseous nebulae have been observed from space centering in each
Field.
9. The Earth’s surface layer (lithosphere) and the physical aspects of plate
tectonics (subduction zones, plate boundaries, rises, rifts, stress
patterns, earthquake-wave anomalies, etc.) are related to the Fields’
locations (further discussion is in section 3.4).
10. Lighted displays (ionized particles) and dark masses (neutrons) have
been observed repeatedly [in these areas.]
11. Patterns and changes in the upper atmosphere, radiation belts, and the
magnetosphere show relationships to the Fields.
12. Eels, iron-precipitating bacteria, and electric fishes are
geographically located in these areas.
13. More than 70 percent of all life on Earth is situated in relation to
the
Fields (between the 40-degree latitudes), which is ideal for the generation
of electrical energy by life.
Indeed, a great portion of Pasichnyk’s Vital Vastness trilogy of books
centers around the study of these “Fields” as they occur on Earth and other
planets. In Chapter 12 of our previous volume, we summarized a majority of
convincing information from Pasichnyk that shows that these Fields are at
work on each planet throughout our solar system. As we can see, all of the
above effects could be caused by the power that strong torsion fields can
exert on physical matter, as torsion fields do create tangible pressure. It
is this pressure that appears to be responsible for forming the currents we
measure in the oceans and atmosphere, which Pasichnyk’s research shows are
all associated with the
Earth’s Grid.
As we have already indicated, areas of higher torsion-field intensity are
also areas where matter is capable of shifting into a higher level of aetheric density. The key here is to realize that
matter and energy can
indeed be displaced into a higher level of aetheric density at these twelve
nodes on the Global Grid, due to the high degree of torsion radiation in
these areas, and this has already been documented and observed in the 20th
century through the work of Ivan P. Sanderson, among others.
In 1972, Ivan Sanderson published an article entitled “The Twelve Devil’s
Graveyards Around the World” in Saga magazine. These “Devil’s Graveyard”
areas are the same as the “Fields” discussed by
Pasichnyk, and they
represent the points of the icosahedron on the Earth’s grid, as seen in
Figure 5.6. Just as a review, we know that each face of the icosahedron is a
perfect equilateral triangle where every internal angle is 60 degrees.
Within a sphere such as the Earth, the points of the icosahedron are located
between 30 and 40 degrees latitude above and below the equator. Each point
is spaced at 72-degree intervals from the neighboring points, and except for
the two at the poles, their exact geometric center is at 36 degrees North or
South latitude. All together, there are five points in the Northern
Hemisphere, five in the Southern Hemisphere and two at the poles.
Figure 5.6 – The icosahedron (L) and its grid positioning on the Earth (R).
(Courtesy Nick Nelson)
Sanderson discovered these points by doing a massive meta-analysis of all
available data on losses of aircraft and sailing vessels. From this data, he
determined that such disappearances were far more likely to occur at these
twelve points than in any other areas. In Charles Berlitz’ book The Bermuda
Triangle, we are given a greater description of the properties of these
areas, both in terms of Earth’s physical processes as well as the
electromagnetic time-warp anomalies:
These areas… represent the nodal points where the surface ocean currents
turn one way and the subsurface currents turn in another direction. [Note:
Again, we see counter-rotating energy forces.] The great subsurface tidal
currents sweeping tangentially, and influenced by different temperatures,
set up magnetic vortices, affecting radio communication, magnetism – perhaps
even gravity – and eventually, in special conditions, causing air and
surface craft to vanish – sailing or flying off into a different point in
time and space. An interesting sidelight on the erratic behavior of these
areas is underlined by Sanderson in describing the astonishing “early
arrivals” of carefully clocked-in air flights where planes have arrived so
far ahead of schedule that the only possible explanation would be that they
had a tidal wind behind them blowing, for example, at 500 miles per hour.
[Note: Let’s remember that this kind of wind speed is usually only seen in
the worst hurricanes.] Such incidents may be the result of unrecorded winds
but they seem to occur most frequently within the
Bermuda Triangle and other
vortex areas, as if these particular planes had encountered the anomaly but
had skirted or been propelled safely through the “hole in the sky” that had
cost so many travelers their lives.
The vanishings in areas such as the Bermuda Triangle or the
Devil’s Triangle
off the coast of Japan (which we have heavily documented in Chapter 10 of
the previous volume) are produced when the ships or aircraft are displaced
into a higher density of aetheric energy and do not return. The anomalies
related to time are given additional support by Drs. William Becker and
Bethe Hagens in their article “The Planetary Grid: A New Synthesis”, which
was reprinted in the book Anti-Gravity and the World Grid. In this article,
they reported on a time-based anomaly occurring at the node point near
Hawaii:
A pilot flying with passengers near the
Hawaii zone [of the icosahedron of
energy points on the Earth] suddenly found himself in a “dead zone” without
[the use of his electromagnetic] instruments and unable to communicate
beyond the cockpit. After flying some 350 miles, [which most likely took an
hour or more,] the “phenomenon” lifted and the pilot found that tower
officials could find no measurable time that had elapsed between the
beginning of his “dead zone” experience and its end. [emphasis added]
These changes in the rate of time’s passage fit clearly with
Kozyrev’s
theories that the flow of time is a function of torsion radiation, which is
in turn a function of aetheric energy density. If you move into an area of
higher aetheric density, time may well slow down for you, as it did for the
above pilot. In such cases as this, the ship does return from the
higher-density area to our own level of aetheric energy density, and the
survivors live to tell the tale. Admittedly, this does appear to be an
exception to the rule, but it appears that ancient cultures had a better
understanding of how to not get “lost” in such
vortex-based aetheric
displacements, and were able to use them constructively, such as for
physical travel across the Earth.
In the previous volume we discussed the case histories of firsthand
witnesses who flew into such areas of higher aetheric density and returned
alive. The ultimate example is the case of Charles Wakeley. Briefly, as
Wakeley passed into an area of higher density in the Bermuda Triangle
vortex, his electromagnetic instruments displayed very anomalous behavior,
and a bluish-green glow began growing on the tips of his wings, eventually
turning white and spreading into the cockpit. At the peak of this event, he
was surrounded by blinding white light that seemed to come “from everywhere
at once,” and the effect then dissipated at the same speed that it had begun
with, allowing him to regain control of the aircraft.
As we said in our previous volume,
It is very likely that the tremendous light that he saw around himself would
not have been visible to those on the ground; it was a visual consequence of
his own body moving into a more energetic area. To an outside observer there
would be no change, as his body moves into an area of higher-vibrational
energy that is outside of the time and space that the ground-based observer
would see. If he did not return, his plane would simply disappear from view,
and if he did return then nothing would appear to have happened to an
outside observer; they would only see his plane as a seamless continuity.
5.7 THE BECKER-HAGENS GRID AND NEW
DISCOVERIES OF “GREAT CIRCLES”
An even more complete model of the Earth’s grid has been worked out by
Drs.
William Becker and Bethe Hagens, known as the Becker-Hagens grid. We have
covered this information in both of our previous volumes. This grid was
produced by taking two icosahedrons and rotating one of them slightly out of
phase with the other, a concept originated by Buckminster Fuller in his
Synergetic Geometry magnum opus. A 120-sided polyhedron is formed by this
process which describes all the Platonic Solids. The next figure shows the
basic structure of this model of the Grid, though each triangle has many
sub-lines within it as well. Let us now continue with another excerpt from
our previous volume that helps us to understand what we are seeing:
From this grid design, we can see that the current structure of continents,
island chains, mountain ranges, oceanic ridges and much more all follow this
pattern. By slowly and carefully studying this map, as we have documented in
The Shift of the Ages, we can see that it looks as if the Earth itself is a
flexible balloon that is surrounded by this grid. If the grid is akin to a
set of wires, and the wires are exerting force on the balloon, then we can
see how they are pushing the landmasses into their current formation.
Figure 5.7 – The Becker-Hagens Grid, inspired by the work of Chris Bird.
By studying the map carefully, it becomes easy to see how the continents are
pushed and pulled by this Grid. We have diligently covered all the most
important points in both of our previous volumes. For just a few examples,
note how South America is perfectly surrounded by lines, and how the bottom
of that landmass is pushed to the right by node 58, while
node 49 pushes in
on its eastern coast near Rio de Janiero in Brazil. Also note how Australia
is perfectly stretched out between nodes 43 and 45, with the top of the
continent forming a nearly circular bay area around node 27, also
incorporating the smaller landmass of New Guinea directly above it.
In order to make certain formations more visible, in the next figure we
digitally altered the map so that it can be seen exclusively from the area
of the Pacific Ocean. If we think back to Dr. Jenny’s models of
Platonic
Solids in vibrating fluid, we remember that spiraling curves could be seen
between the various nodes, forming a smooth contrast to the straightness of
the lines on the geometries themselves. We would expect to see similar
formations on the Earth if this aetheric model is indeed correct. Through
the study of island chains and mountain ranges, we can indeed see
large-scale circular structures just like those that surrounded the
formations in Dr. Jenny’s experiments.
Figure 5.8 – Wilcock’s “Great Circle” Discoveries in Asia / Pacific Ocean
area of Earth’s Grid
For starters, when we look at a world map that shows mountain ranges, we
will discover that almost the entire western edge of Asia is bordered by a
smoothly curving set of mountains that has no single name. In the map, we
have crudely drawn in this mountain range with a series of curling lines at
the far left of the larger circle. The position of this mega-range
corresponds with extreme precision to an ellipse that can be drawn between
nodes 12, 4 and 5, passing up through Pakistan and
Afghanistan, the western
edge of China, the border of Russia and Mongolia and then the border of
Russia and northeast China, continuing right until the ocean coastline. The
elongated sea in Russia just to the right of node point 4 (see previous
figure) is almost perfectly aligned with this ellipse as well. We can now
combine this data with other smaller-scale formations, such as the island
chain of Taiwan, the Philippines, New Guinea and the Solomon Islands, to
show that there are indeed giant circular structures of energy upwellings to
complement the sharp lines of the geometric grid.
Importantly, both of these “Great Circles” neatly and symmetrically
contact
many nodes on the Earth’s grid, and both circles perfectly align with Russia
and Alaska at their northern edge. Other formations can be seen on this map
as well, such as the chain of islands formed by the bottom peninsula of
Myanmar (Burma,) Thailand and Malaysia, and most specifically the primary
island chain of Indonesia. This island chain forms an almost perfect
semi-circle just to the left of the smaller circle that we have drawn into
this map. It is also highly interesting to note that the smaller circle on
this map looks very similar to the final stage of cell mitosis, with nodes
14 and 16 resembling cell nuclei and the vertical line between them
resembling the dividing chromosomes.
In the next figure, we show an energetic structure that is centered on node
number four in Siberia, where many magnetic anomalies have been recorded and
analyzed by Dr. Aleskey Dmitriev and others. If we take this point as our
center, then we can see an expanding spiral that appears to have formed from
it. This spiral has three major “arms”, formed by the Ural Mountains in
Russia, seen on the left hand side of the outer circle, the Himalayan
mountains that cross through Pakistan, Kashmir, India, Nepal, Bhutan and
Tibet, (which we have only shown with a very thin line to emphasize their
curving, spiral formation,) and the Japanese island archipelago. Once you
see this inward-curling spiral structure for yourself in a world atlas,
looking at the actual mountain ranges, you will never fail to see it again.
This clearly illustrates the leftover traces of the Earth’s stages of
geometric expansion at work. Furthermore, the style of this map projection
distorts the true shape of Russia’s upper coastline, and thus in reality
this circle is far more directly aligned with the shape and position of the
coast than we can see here:
Figure 5.9 – Wilcock’s spiraling “vortex” formation incorporating Ural
Mountains, Himalayas and Japan
5.8 SUMMARY
So, with the information that we have uncovered in this chapter, we now have
established a clear connection between the energetic behavior that has been
observed at the quantum level with that of the planetary level. Just as
“explicit angular-dependent many-body forces” must be invoked to explain the
formation of microclusters, similar geometric forces are clearly at work in
the plasma formations observed in Hessdalen, Norway and indeed in the
Earth
itself, which has a geometrically-structured plasma core and an evolving
geometric complexity of the continental positions as it expands in its
physical size. We also now have a new view of earthquake formation that
explains why we see plasma formations during times of high seismic activity,
and which also fits in with the concept that the Earth’s core is composed of
luminous plasma. The anomalous disappearances of ships and aircraft at the
node points of our Global Grid clearly point to the validity of a model
involving multiple densities of aether, where matter can be displaced from
one density to another if the torsion-wave pressure within the molecules
rises high enough to cross the vibratory rate of the speed of light.
From here, our next step is to expand this “holographic”
model even further,
by demonstrating that these same energetic principles are at work throughout
the entire Universe, at every level of size, with simple but precise
harmonic principles defining their relationships to each other. This will
truly establish a unified model that has never before been seen in any
modern scientific work, but which is most likely a return to ancient
understandings of the Divine Cosmos. The following two chapters form the
heart of the model that this book is presenting, and will draw upon all of
the previous knowledge that we have covered in this book up until now.
REFERENCES:
1. Berlitz, Charles. The Bermuda Triangle. (1974) Avon Books, New York, NY.
ISBN: 0-380-00465-8 [See also
HERE]
2. Braden, Gregg. Awakening to Zero Point. [Videotape Presentation] 1996.
URL:
http://www.greggbraden.com
3. Corliss, W.R. (comp) (1982) Lightning, Auroras, Nocturnal Lights and
Related Luminous Phenomena. A cagalog of Geophysical Anomalies. [and] (1991)
Inner Earth: A Search for Anomalies. Glen Arm, MD, Sourcebook Project.
4. Dmitriev, Aleskey.
Planetophysical State of the Earth and Life.
5. Dziewonski, A.M., Woodhouse, J.H. (1987) Global Images of the Earth’s
Interior. Science 236:37-48.
6. Howe, Linda M. Scientists Say Mysterious Lights in Hessdalen, Norway are
Thermal Plasmas. (2001) November, 2001. [Technical references in this
article to Dr. Massimo Teodorani and Prof. Erling Strand’s research.] URL:
http://www.earthfiles.com/earth301.htm
7. Maxlow, James. Expanding Earth Theory. URL:
http://www.tmgnow.com/repository/global/expanding_earth.html
8. Pasichnyk, Richard. The Vital Vastness – Volume One: Our Living Earth.
Writer’s Showcase / Iuniverse.com, 2002. ISBN: 0-595-21078-3; URL:
http://www.livingcosmos.com
9. Persinger, M.A., Lafreniere, G.F. (1977) Space-Time Transients and
Unusual Events. Chicago, Nelson Hall.
10. Wilcock, David.
Convergence III – Extraterrestrial Physics. 2001.

|