|

12.1 HOAGLAND’S MARS
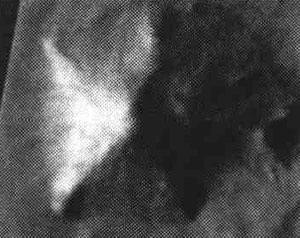
In 1976, frame 35A76 from the Viking Orbiter 1 satellite (seen in the second
image below) showed a formation that strongly resembled a human face with
what appeared to be some form of Egyptian-style headdress around it. Since
that time, there has been a great deal of speculation and controversy
surrounding the object, in an area of Mars named “Cydonia,” with
NASA
failing to officially endorse it as anything but a natural formation whereas
other researchers such as Richard Hoagland, Tom Van Flandern and
Stan Mc
Daniel have studied it in detail and concluded that it must be a product of
intelligent design.
For our purposes in this chapter, we will focus on the work of Richard
Hoagland. Through work with electrical engineer / digital image processor
Vincent DiPietro and computer scientist Greg Molenaar, Hoagland’s team was
able to develop an early, accurate version of image enhancing software,
which brought out details on the shadowed side of the photograph that would
otherwise be impossible to see. These details made it clear that
the Face
possessed “bilateral symmetry,” meaning that it looked the same on either
side… it looked like a Face.
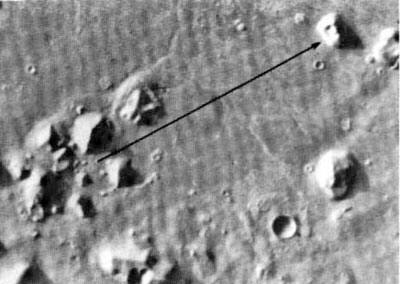
Later, frame 70A13 was discovered, which further unveiled the other side of
the Face and additional details as well. What appeared to be a gigantic
five-sided pyramidal object was situated a mere ten miles to the southwest
of the Face structure. The structure is almost certainly artificial due to
its striking five-sided symmetry, straight lines and rounded “buttresses” at
the corners that appear to have been used to help support the artificial
structure itself.
The “D&M Pyramid” from Viking frame 70A13.
Furthermore, in an area approximately ten miles due west of the Face, a host
of other roughly pyramid-shaped mounds were gathered closely together, and
hence the whole area was named "The City." One object in particular appears
to be literally identical in its appearance to an aerial view of the Great
Pyramid, and it can be seen directly above the left-hand side of the arrow
in the next image. If you look closely at this pyramid, you can see what
appear to be two miniature pyramid-shaped mounds that are directly next to
it on the top and left side. Both of these smaller mounds are located at the
exact middle of the pyramid faces, which again suggests intelligent design
and not a freak of nature.
The “Face” and “City” from Viking frame 35A76.
Then, immediately above and to the right of the biggest pyramid is another
object dubbed “The Fort,” which again seems to show the unmistakable signs
of right-angle geometry and artificial structure. The arrow in the image
demonstrates the alleged ritual significance of the Face, in that on that
line of sight, the sunrise on the all-important date of the Equinox would
occur directly behind the Face. A mound of earth many miles to the east of
the Face seemed to serve as a means to deflect glare and make this Sunrise
even more sudden and powerful to behold.
The most recent NASA photographs have only increased the resolution with
which we can view this area, but this was never even featured in the
mainstream media with any real seriousness until 2000, with the release of
the Mission to Mars film from the Disney corporation. And on April 27 and
29, 2001, a one-hour special entitled “What is Really on Mars” on the
NBC-affiliated cable station PAX-TV aired on these issues. In Hoagland’s own
words, over a long period of time he was "dragged kicking and screaming" to
the idea that the objects in this area could actually represent
extraterrestrial archeology, and the case continued to become more and more
compelling. And in 1996
the McDaniel report independently analyzed the
evidence and also concluded that there was overwhelming evidence for
artificiality in the Cydonia area. The important point to remember with the
McDaniel Report, at
http://www.stanmcdaniel.com/mars/mars.htm
and
http://www.enterprisemission.com/mcdaniel.html, is that this work was done
completely outside the auspices of Hoagland’s research by Ph.D. scholars.
12.2 THE TETRAHEDRON REVEALED
Erol Torun joined Hoagland’s Mars Mission in 1988, and contributed his
expert cartographic skills from the United States’ own Defense Mapping
Agency to the project. He was the first to "orthographically rectify" the
Viking images, meaning that he correctly installed a precision grid of
coordinates that were properly aligned North to South on the images, thereby
turning them into exact maps. This allowed the Mars Mission to
mathematically calculate the exact angles, distances and relationships
between the different objects in the Cydonia region. Hoagland had already
proposed that if a message were to be encoded in the city, it would most
likely take the form of universal mathematical values that others would be
able to decode, by virtue of the innate, unchanging laws of number and
geometry.
Within a reasonably short time and a great deal of excitement, the evidence
mounted to indicate that one of the main functions of this City was indeed
to give an encoded, sacred geometric "message" to its inhabitants and future
discoverers. Various mathematical constants such as “e”, which is a
well-known function in trigonometry at a value of 2.718282, and values such
as the square roots of 2, 3 and 5 were all seen clearly in the relationships
between the objects on the map. (We remember that it was Torun’s job with
the United States’ Defense Mapping Agency to come up with such precision
measurements from a single map.) It is well known to mathematicians that the
Platonic Solids show the three square root values of 2, 3 and 5 inside of
themselves, so Torun decided to investigate the mathematics of all five of
the Platonic Solids – the octahedron, tetrahedron, cube, dodecahedron and icosahedron – more fully.
Torun also focused in on the function “e”, which is known as “the base of
natural logarithms.” Unfortunately, most of us do not know anything about
what this means, and the Enterprise Mission articles and books do not
explain it any further. In fact, “e” is a value that allows certain
mathematical operations (logarithms) to grow larger in the most symmetrical
or “natural” manner possible. Logarithms are directly connected to
exponents, which many of us might remember seeing as the tiny numbers that
are placed to the upper right of another number. If you see a big 10 with a
little 5 next to it on the upper right, you read it as “ten to the fifth
power.”
The most common logarithms are those where you keep multiplying a number by
factors of ten, and the little exponent number would show you how many times
you should do this. In our above example, ten to the fifth power would be
one million. However, if you keep multiplying a number by “e” or
2.718282,
instead of multiplying by ten, the calculus studies showed that the number
will grow larger in a much more symmetrical, geometrically balanced fashion.
The “e” function shows up on a graph as a perfectly smooth curve that looks
like a quarter-circle, from the top left to the bottom right.
Torun excitedly discovered that there was a direct connection between “e”
and the geometry of the tetrahedron, which was largely or totally unknown by
most scientists. First, take a sphere and fit (or circumscribe) a
tetrahedron perfectly inside of it. If you calculate the overall surface
area of the sphere and then divide it by the overall surface
area of the
tetrahedron, you get a value that is very close to “e”.
At this point, no
one is really sure exactly why this is, though there are some ideas. The
only thing that we need to focus on right now is that this value could be
used to form a message, encoded in mathematics.
So if we truly want our message to be complete, and for those who find it to
have no doubts left in their mind that they are right, we need to have
something to compare “e” against that would represent the value for the
sphere. We remember that “e” represents the ratio between the tetrahedron
and sphere, a difference that is caused by the presence of the tetrahedron;
so, we should also try to find a different constant that would define the
sphere directly. This is much more easily seen, as the value of “pi” or
3.14159 is the length of the circumference of any circle or sphere, if the
diameter of the circle is assigned a numerical length of one. So our second
value to compare against “e” would be “pi,” something that anyone in the
universe could calculate the same way, through the simple geometric analysis
of a circle.
So, if the two values at work are “e” and “pi”, then
Torun felt that it
would be best to divide them into each other to represent the main ratio
between the tetrahedron and the sphere. When this “e / pi ratio” is
calculated, we get a value of about 0.865. And, quite remarkably, this ratio
showed up over and over again on Cydonia. For example, it can be seen in the
ratio between a 19.5 and 22.5-degree angle, and is also seen between a 60
and 69.4-degree angle. Both of these angle pairs are clearly and
unambiguously seen in the geometry of Cydonia.
However, the most satisfying discovery of all was when Torun studied the
value in degrees for the actual latitude of the Martian Monuments,
specifically at the point of the central five-sided geometric figure in the
city, known as the “D&M Pyramid.” This object is located at
40.87 degrees
North latitude on Mars, and when we apply the universal mathematical
function known as the ‘arc tangent’ to this number, we get 0.865 – the same
e/pi ratio again! So, what that means is that the entire placement of the
Cydonia monument complex, in a 360-degree coordinate system of latitude, is
designed to show the geometric “message” of the
tetrahedron in the sphere to
anyone who would choose to pay Mars a visit. By the time this is seen, there
should be no doubt left that all of this work was done deliberately, in a
360-degree coordinate system.
So, next we see an Enterprise Mission image of the circumscribed tetrahedron
– a tetrahedron placed within a sphere – as measured in Cydonia. [And we now
should know to visualize the sphere as having an axis through the center,
thus making it a spherical torus.]
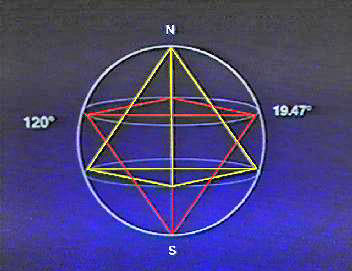
Enterprise Mission image of circumscribed tetrahedron.
The simplest of the many geometric demonstrations of the tetrahedron in the
sphere at Cydonia can be seen with the approximately
19.5-degree angles
between objects. This angle measurement represents the number of degrees
above or below the equator where three of the tetrahedron’s tips (or nodes)
will be situated. The fourth tip, of course, would be at either the north or
south pole. The five-sided “D&M Pyramid” was referred to as the
“mathematical Rosetta stone* of Cydonia” because for one, it was tilted
exactly 19.5 degrees away from the east-west latitude lines of Mars, and
within the D&M Pyramid were several other key angles of the circumscribed
tetrahedron, such as 49.6 degrees, as well as the 60 to 69.4 or
“e/ pi”
angle ratio. It was the D&M Pyramid that allowed them to decode the rest of Cydonia.
(* Note: For those who are not familiar with the story of the
Rosetta stone,
this was a carved tablet that featured a set of inscriptions with the same
message written in three different languages, one of which was Egyptian
hieroglyphics and another of which was well known to modern humankind. From
the Rosetta stone, the entire Egyptian hieroglyphic language was able to be
decoded.)
In the original “Message of Cydonia” paper by
Hoagland and Torun, followed
by a detailed set of photographic and analytical data in Hoagland’s book
The
Monuments of Mars, a huge range of mathematical correlations in the
placement of certain key objects were outlined, some of which we have
briefly covered in this chapter. One of the most startling facts is that a
perfect equilateral triangle is formed between the Face,
the D&M Pyramid and
the City. For those who are interested in learning more, the books and
papers are easily available through
the Enterprise Mission; most other writings on the subject that are
typically found on Internet websites tend to lack many key pieces of the
puzzle, and incomplete attacks are often formed by skeptics as a result. So,
when properly examined, these findings added to the central case without
exception:
If you want to decode the
Message of Mars, study the idea of a tetrahedron
inside a sphere.
So what exactly does this mean? Based on what we have already been
discussing in this book, we are in a good position to ask that question.
What would happen if we investigated how this geometry was involved with the
planet-wide “consciousness unit” formations that we have already been
investigating? Should we expect to see some form of anomalous phenomena at
these key “tetrahedral” points on the planets, as we have done with
Sanderson and Pasichnyk’s twelve “icosahedral” vortices here on Earth?
12.2.1 TETRAHEDRAL VORTEX GEOMETRIES
The icosahedron is one of the five main Platonic Solids, and the
tetrahedron
indicated on Mars is another. So if we are already seeing the
icosahedron at
work on the planets, which definitely have a spherical torus for a magnetic
field, then should we also be looking for the tetrahedron, as the
Message of Cydonia would lead us to believe? Would we also expect to find a spiraling,
vortexual movement at the node points of a tetrahedron-shaped energy field
that exists inside the sphere of a planet? Would this vortex movement have
some of the same qualities as the tornado? Indeed, Hoagland’s team found
striking evidence of this energetic configuration in many of the bodies in
our Solar System. Here is the complete list of “tetrahedral”
anomalies on
planets from the original “Message of Cydonia” paper by
Hoagland and Torun:
|
Planetary Latitudes
of Emergent Energy Phenomena
|
|
Object
|
Feature
|
Latitude
|
Comment
|
|
Earth
|
Hawaiian Caldera
|
19.6 N
|
Largest shield volcano
|
|
Moon
|
Tsiolkovskii
|
19.6 S
|
Unique Farside “mare-like”
lava extrusion
|
|
Venus
|
Alta Regio
|
19.5 N
|
Current volcanic region
|
|
Beta Regio
|
25.0 S
|
Current volcanic region
|
|
Mars
|
Olympus Mons
|
19.3 N
|
Largest shield volcano (3x
the size of Mont Everest)
|
|
Jupiter
|
Great Red Spot
|
22.0 S
|
Vast atmospheric
“vorticular upwelling”
|
|
Io
|
Loki (2)
|
19.0 N
|
(Voyager 1& 2 volcanic
plumes) Presumably driven by intense Jovian tidal forces and / or Jovian
magnetic field
|
|
Maui (6)
|
19.0 N
|
|
Pele (1)
|
19.0 S
|
|
Volund (4)
|
22.0 N
|
|
Saturn
|
North Equatorial Belt
|
20.0 N
|
Region of “storms” observed
from Earth
|
|
South Equatorial Belt
|
20.0 S
|
|
Uranus
|
Northern IR 1-2 K “dip”
|
20.0 N
|
Presumably deep
“upwellings,” creating high-altitude clouds
|
|
Southern IR 1-2 K “dip”
|
20.0 S
|
|
Neptune
|
Great Dark Spot
|
20.0 S
|
Presumably same as Jovian
counterpart
|
Source: NASA and US Geological Survey
So from this table, we can clearly see that the tetrahedral “pattern” holds
throughout most of the entire Solar System. Somehow, the aetheric energies
appear to be continually flowing through these geometric patterns, forming
spiraling vortices at each point. Both the Great Red Spot and the
Great Dark
Spot are clearly tornado-like vortices that seem to have a perpetual
existence that is unexplainable in conventional models. The Great Red Spot
has been observed on Jupiter for over 300 years without changing, appearing
as a gigantic red vortex of spinning clouds that is big enough to fit two
Earths, and no conventional scientists can explain exactly why it has
remained in place so persistently. The volcanoes seen on other planets will
most likely have a spiraling area of liquid magma under them as well, thus
conforming to the “flow” of aetheric energy that is seen around the points
of the tetrahedron.
A recent article in Science News, linked at
http://newton.ex.ac.uk/aip/physnews.255.html#3, shows us the possibility of
“Great Red Spot” phenomena occurring outside our Solar System, in this case
on the giant star Betelgeuse. It is very likely that further research will
confirm that such spots exist at the 19.5-degree latitude:
THE FIRST DIRECT IMAGE OF THE SURFACE OF A STAR other than our sun was
reported by Andrea Dupree of Harvard-Smithsonian. The surface of the star,
Betelgeuse, had been indirectly imaged earlier using speckle interferometry,
in which many brief exposures are added up to make a composite image.
Dupree’s pictures, made with the Hubble Space Telescope, confirm previous
suspicions that Betelgeuse’s surface exhibits a giant bright spot. According
to Dupree, the spot is 2000 K warmer than its surroundings and that this
might be indicative of a new physical phenomenon at work in some stellar
atmospheres.
Returning to our own Solar System, another point of great interest was that
the Martian city “Cydonia” itself was located exactly 120 degrees west of
the huge Olympus Mons volcano, which is situated at 19.3 degrees North.
Obviously, says Hoagland, the volcano is formed by one of the nodes of the
tetrahedron. Then, the 120-degree offset longitude of the City is exactly
one-third of the 360-degree circumference of the globe, and is therefore on
the same longitude line as another one of the tips of the tetrahedron. This
again says suggests that the energy from the vortex was somehow being
harnessed for use with energetic technologies at the City.
And after the above chart of data was originally compiled, the Enterprise
Mission also realized that in the Sun’s cycles of activity, the sunspots
would peak at roughly 19.5 degrees above or below the equator before moving
towards the Equator again; this seemed to be their “ideal” location when
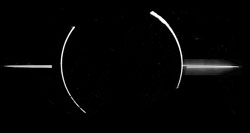
everything was in balance. Furthermore, a bizarre, hexagonal formation in
the clouds at the North Pole of Saturn seemed to show the tip of the
tetrahedron, where the energy was flowing into the spherical torus itself.
The perfect circle at the outside of each image and the straight dark lines
moving toward the center also show clear signs of a “node point” of a
vortex:
Anomalies of Saturn’s north pole, showing hexagon shape and vortex motion.
12.3 GEOMETRIC EQUILIBRIUM OF FORCES BY VIBRATION
So if there is indeed something going on here with geometry, what could it
be? High rotational movement, gravity changes, matter changes and time warps
on these spots? Why geometry, of all things? Aren’t straight lines simply a
manmade invention that is unseen in nature? In this book we will suggest
that the whole “point” of geometry is vibration, as these geometries
naturally emerge within a vibrating fluid. And different geometries mean
different vibrations. The geometry of vibration is what allows the balance
between vortex points to occur.
As we illustrated in previous chapters, the “vacuum domains” seen by
Dr. Dmitriev in so many different anomalous ways have a clear 180-degree
polarity, hence we have called them “polarized consciousness units.” This
consciousness-unit formation shows the greatest strength at the north and
south poles, and produces very high energetics as the aether finds a
powerful gateway to bleed into our reality. This high-energy,
polarized-gravity situation is clearly not suitable for the requirements of
a planet; it is not balanced enough. Tornadoes, for example, are hugely
destructive and rotate at tremendous speeds.
In order to successfully form a planet, we would need these powerful forces
seen at the North and South poles to be more effectively spaced out across
the globe itself, so that the planet can maintain its structure and balance
without being torn apart. And now, with our knowledge of the properties of a
vibrating fluid, we can see that Nature has already provided the answer for
us. Forms such as the tetrahedron and icosahedron take some of the
“pressure” off of the flow through the rotational axis and allow these
forces to “space out” and flow more evenly through a planet, streaming like
rivers around all points of the geometric fields that are formed inside the
planet. And most importantly, the simple properties of vibration give us the
key that makes this possible, as we will see in the next chapter.
12.4 “FIELD-DYNAMICAL MODEL” THROUGHOUT THE SOLAR SYSTEM
In the next chapter we will lay out the complete case to show the
vibrational connections between light, sound and geometry; however in the
remainder of this chapter, we will compile more of Richard Pasichnyk’s
ingenuous findings on planetary energy processes into a streamlined and
organized form to compare them with Hoagland et al’s findings. Here, what we
will be discussing is Pasichnyk’s observation that the “Field-dynamical
model” can be seen throughout the Solar System, on every planet. This
obviously lends a dramatic new layer of proof to the idea that each planet
is a “consciousness unit” with its own geometric Grid formation. We
obviously did not have access to this data when writing The Shift of the
Ages.
12.4.1 ENERGETIC RING FORMATIONS IN THE CU
Before we launch into a description of these connections, we must cover one
additional aspect of Pasichnyk’s model. We have seen that when a consciousness unit is not totally “polarized,” its fields enter through both
the north and south pole, then spreading out to form shapes such as the
icosahedron. However, the rotational axis will always remain in the field as
a clearly visible “line” that runs through the sphere from top to bottom.
Similarly, says Pasichnyk, the “ring” formation that can be seen around a
planet such as Saturn is formed by these same energetic forces. In this
case, as the fields enter from each pole, they crash together at the exact
geometric center of the sphere, where they first cross. This forms energy
and matter that is then structured into rings by the various nested
spherical fields that we have seen in previous experiments. So, just as the
axis forms in the exact north-south polarity of the sphere, the ring forms
in the exact east-west polarity. The axis curves through the center as a
straight line, and the ring radiates across the center as a flat plane that
extends around 360 degrees to form a circle.
And, as Walter Russell showed by experiment in his book
Atomic Suicide? and
Peter Kelly later replicated, the ring around the sphere can be formed in
the laboratory, solely with intersecting magnetic fields. In this
experiment, which we described in Chapter 10, two cone-shaped electromagnets
are set to face each other at their points, and when they are turned on, a
bucking energy field forms between them. Tiny iron shavings can be dropped
between them and instead of falling, they will arrange into a spherical
formation. This is caused by the fact that a sphere-shaped area of magnetism
is being formed between the two cones. Then, when the two cones are
gradually pulled apart, without gravity or rotation, the sphere bulges and
then forms a ring.
Therefore, from Walter Russell’s replicable experiment, we can see that the
ring is a natural consequence of the interaction of spiraling cone-shaped
magnetic fields that are entering the sphere from both sides, not just a
single flow from the top or the bottom as seen in a polarized CU. This would
explain why Dmitriev’s “vacuum domain” formations were not seen to have
rings surrounding them in this fashion:
The ring is the obvious point of geometric balance between fields that are
entering and intersecting from both poles of the sphere.
In the
polarized CU the energy flow only enters at one pole and exits at the
other, and no ring is formed.
With this new piece of data in mind, we can proceed. Although most people
believe that only Saturn has rings, Pasichnyk summarizes recent research by
showing that all the planets show some form of a ring, or at least a “ring
current” of energy at their equatorial regions.
12.4.2 TIME-VARIABLE PHENOMENA
One other point should also be made regarding Pasichnyk’s research. He
frequently points out phenomena in the planets that are time-variable,
meaning that there are energetic effects that change over the course of
time. We should already expect this to be true based on the work of Prof. Shnoll, who showed that the reaction rates of atoms and molecules are
directly affected by planetary and celestial movements such as the day, the
lunar month, the solar year and even the “sidereal” passage of the Earth
through the galaxy. Measurements of different compounds taken at the same
time will show nearly identical variations, thus indicating that all
molecular structures on a given planet are being affected in the same
manner.
Furthermore, in the last chapter we have already shown that the Earth’s
magnetic field, gravitational field and rotation speed can all change,
either from solar eclipses, which decrease the amount of instreaming solar
energy, or from periods of solar maximum, which increase the amount of
available energy. So, in the new model we can expect all the planets to show
noticeable changes that vary with time. And let’s not forget that gravity is
actually being formed by the push-pull of instreaming and out-flowing
aether
energy.
So, with Mercury and the rest of the planets, we will start with some
general facts and then try to break down Pasichnyk’s main points into five
categories, in order to form a logical, organized and easy to read
structure. These five categories will be magnetic anomalies, time-varying
phenomena, luminous/energetic phenomena, ionospheric/atmospheric anomalies
and structural/geometric anomalies, and there will by necessity be some
overlap between categories.
12.5 MERCURY
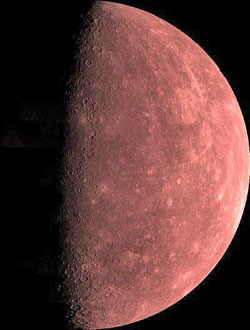 Mercury has a radius of 2,439 kilometers and a mass of 3.30e23 kilograms. It
has been visited directly only once, by the Mariner 10 spacecraft, which
flew by three times in 1974 and 75. Only 45 percent of its surface was able
to be mapped at this time. Curiously, in 1965 it was discovered that Mercury
will rotate three times in two of its passes around the Sun, making it the
only planet with an orbital / rotational resonance that is other than some
level of one-to-one. More recent radar observations of Mercury’s north pole
have shown evidence of water ice in certain craters, which shield the ice
from the Sun, another quite unexpected anomaly. Mercury has a radius of 2,439 kilometers and a mass of 3.30e23 kilograms. It
has been visited directly only once, by the Mariner 10 spacecraft, which
flew by three times in 1974 and 75. Only 45 percent of its surface was able
to be mapped at this time. Curiously, in 1965 it was discovered that Mercury
will rotate three times in two of its passes around the Sun, making it the
only planet with an orbital / rotational resonance that is other than some
level of one-to-one. More recent radar observations of Mercury’s north pole
have shown evidence of water ice in certain craters, which shield the ice
from the Sun, another quite unexpected anomaly.
12.5.1 MAGNETIC ANOMALIES
-
Magnetic field similar to Earth.
Mercury has a weak magnetic field that is
very similar to the Earth’s, only with its behavior and events occurring at
a more rapid speed. The Sun’s influence on the magnetic field appears to be
responsible for this faster speed of behavior, since Mercury is much closer
to the Sun and orbits it much more quickly. In the current dynamo theory,
Mercury shouldn’t have a magnetic field at all.
-
Core anomalies. Based on the conventional concepts of planetary formation,
Mercury’s core should have either solidified or frozen out very early in its
development. This would prohibit Mercury from forming a magnetic dynamo in
the current model.
-
Slow rotation. Mercury rotates very slowly on its axis. This also creates a
tremendous problem for the idea that its magnetic field is powered by the
dynamo model.
-
Stronger electric field. Furthermore, the magnetosphere of Mercury has a
comparably stronger electric field than the Earth does, again suggesting
that this is directly related to the energy it takes in by its close
proximity to the Sun.
12.5.2 TIME-VARYING PHENOMENA
The time-varying phenomena on Mercury include the following:
-
Radio emissions from Mercury can be seen to disappear at certain points,
then reappear. We have no means of explaining this in current models.
-
Electrons and protons are seen to fluctuate around
Mercury in six-second
intervals. This suggests that the center of Mercury is a time-varying source
with nuclear activity.
-
Auroras on
Mercury vary with time, though in conventional models they should
remain steady because of how close Mercury is to the Sun.
-
Bright emissions of ultraviolet light at short wavelengths were seen to
appear and disappear over the course of a few days on Mercury’s
dark side.
12.5.3 LUMINOUS / ENERGETIC PHENOMENA
-
Auroras can be seen at the 30-degree latitudes, as is expected from the
icosahedron-based energy field.
-
Hazy formations can be seen in Mercury’s middle latitudes. This suggests an
atmosphere. However, Mercury is not supposed to have an atmosphere due to
its closeness to the Sun.
-
Luminous spots have been seen on Mercury’s surface.
-
Rings have been seen around
Mercury, which are dark and nebulous with a
purple tinge.
12.5.4 IONOSPHERIC / ATMOSPHERIC ANOMALIES
-
Trapped particles are contained in Mercury’s ionosphere that are too dense
for conventional scientific explanations. This suggests that an internal,
dynamic mechanism is generating them from within, as we would expect in Pasichnyk’s model.
-
Helium, hydrogen and oxygen are contained in Mercury’s atmosphere. In
conventional models there isn’t enough gravitational strength for Mercury to
hold onto an atmosphere; the solar wind should have blown it away.
-
Pasichnyk
suggests that Mercury is generating these particles from within, via
hydrogen fusion and its by-products occurring in the planet’s core. The
magnetic fields, as we now understand them in this new model, are what keeps
this atmosphere from being blown away.
12.5.5 STRUCTURAL / GEOMETRIC ANOMALIES
-
Density. Mercury is only one tenth as big as Venus or Earth, but it is
extremely dense inside. This density is high enough that the conventional
models for planetary formation– either the condensation of dusts and gases
or the gathering together (accretion) of meteors and planitesimals – have no
means of accounting for this. Later in this book we will see a new
explanation for why this might be.
-
Tectonics. The majority of Mercury’s tectonic movements show that they are
aligned with the poles, the equator and the middle latitudes, as expected in
the icosahedron-based Field-Dynamical Model.
-
Polar auroras. Auroras are seen
over the poles of Mercury, which again
should not be possible in conventional models. We remember that this is
showing us where the energies are streaming into the luminous core of the
planet.
-
Polar ice. As we stated above,
ice has been seen on Mercury’s north pole,
again showing that anomalous phenomena are occurring there, given Mercury’s
innate heat. Mercury is not a “molten” planet on the surface as some have
been led to believe, but it is certainly hot enough to make this an anomaly.
Where would the vapors have come from?
12.6 VENUS
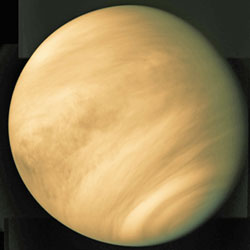 Venus’ orbit almost forms a perfect circle, more than any other planet in
the Solar System. It is 12,103.6 kilometers in diameter and 4.869e24
kilograms in mass. It was first visited by Mariner 2 in 1952 and has since
been visited by more than 20 other probes. It is only slightly smaller than
the Earth in size, and it very probably once had large amounts of water like
Earth, but this water was later boiled away. It is now surrounded by very
dense clouds, and has no moons. It rotates very slowly on its axis in a
retrograde or “backward” motion, and most interestingly, “the periods of
Venus’ rotation and of its orbit are synchronized such that it always
presents the same face toward Earth when the two planets are at their
closest approach.” This suggests an interplanetary, energetic connection
that links the two planetary orbits, which we will cover later. Venus’ orbit almost forms a perfect circle, more than any other planet in
the Solar System. It is 12,103.6 kilometers in diameter and 4.869e24
kilograms in mass. It was first visited by Mariner 2 in 1952 and has since
been visited by more than 20 other probes. It is only slightly smaller than
the Earth in size, and it very probably once had large amounts of water like
Earth, but this water was later boiled away. It is now surrounded by very
dense clouds, and has no moons. It rotates very slowly on its axis in a
retrograde or “backward” motion, and most interestingly, “the periods of
Venus’ rotation and of its orbit are synchronized such that it always
presents the same face toward Earth when the two planets are at their
closest approach.” This suggests an interplanetary, energetic connection
that links the two planetary orbits, which we will cover later.
12.6.1 MAGNETIC ANOMALIES
-
Weak magnetic field. Since Venus is closer to the Sun than Earth, our
scientists expected it to have a stronger magnetic field. This is due to the
belief that Venus must have formed a liquid core with the expected
conditions of temperature and pressure. However, Venus’ magnetic field is so
weak that it was measured as being near zero for a long period of time.
-
No vertical component to magnetic field. Venus’ skimpy magnetic field only
moves east to west, not north to south along the axis of rotation.
Scientists admit that this poses a severe challenge to the dynamo model.
Yet, when we start to see the new model, other options for magnetic fields
become possible, as the center of a planet is comprised of luminous aetheric
material that is forming the magnetic field, not a solid core.
-
Magnetic responses to solar wind. In periods where the pressure of the solar
wind is very high, Venus’ magnetic field undergoes strong, large-scale
variations, thus indicating a direct link between the two as we would
expect.
12.6.2 TIME-VARYING PHENOMENA
-
Changing speed of “particles.” In the Venusian atmosphere, oxygen ions and
protons are seen to change their speeds of travel in relation to each other,
in defiance of all known understandings.
-
24-hour changing height of ionosphere. In a
breathing-style movement, the
ionosphere can change from a height of several thousand kilometers to only
200 kilometers, or 125 miles, within a period of twenty-four hours. At the
lower heights, almost no ions will be seen above the 200-km point.
-
4-day changing height of atmosphere. In a cycle that occurs over a period of
four days, the cloud-deck of Venus moves up and down as much as one
kilometer, or 0.62 miles, across the entire surface of the planet
simultaneously. This is referred to by scientists as the “steady breath” of
Venus, and it can be observed by measuring the varying strengths of carbon
dioxide in the atmosphere. This shows the pulsating nature of the true
energy fields that are streaming in and out of the planet on a time-variable
basis.
12.6.3 LUMINOUS / ENERGETIC PHENOMENA
-
Auroras. Due to Venus’ weak magnetic field, it is not expected to have
auroras. The fact that they have been seen supports Pasichnyk’s
Field-Dynamical Model by showing their connection to an internal energy
source and not a “magnetic dynamo.”
-
Oxygen night glow. During times when the solar activity is peaking and solar
flares are released, Venus shows signs of oxygen atoms glowing on the night
side. This was completely unexpected in conventional models and suggests a
solar connection.
-
Increasing glow near surface. Two different probes determined that as you
penetrate the atmosphere of Venus, there is a glow that increases as you
move closer to the surface.
-
Lightning without precipitation. On Venus we have observed lightning that
does not occur in conjunction with rainfall; our current models expect them
to work together. [We remember that this was also seen in the tornado
anomalies of Dr. Dmitriev.]
-
More energy radiated than received. As also noticed by
Richard Hoagland and
The Enterprise Mission, Venus radiates 15% more energy from itself than it
receives from the Sun.
-
Ring or particle density at equator. As the new model would propose, Venus
shows a ring phenomenon of increased particle density at its equator point.
12.6.4 IONOSPHERIC / ATMOSPHERIC ANOMALIES
-
Lack of polar clouds. Venus does not have visible cloud cover over the north
and south pole, suggesting the entry and exit points for energy moving to
the center.
-
Mid-latitude holes in ionosphere. As expected from the geometry involved,
the mid-latitude areas of Venus show “holes” where there is a higher
temperature and an energetic enhancement of the hydrogen ions inside. As the
electric fields and upward flow of ions increase in these areas, there is a
corresponding depletion of surrounding plasma energy.
-
Pressure anomalies. In concordance with the geometry, atmospheric pressure
is highest at about the 30-degree latitudes. High pressure values are also
seen at the Equator and near the pole, at about 60 degrees latitude. (The
pole is 90 degrees latitude.) However, at the pole itself, we find the
lowest pressure of all. These anomalies cannot be explained by the rotation
of Venus but now are fully accounted for.
-
Super-rotating atmosphere. Venus takes an amazingly slow 243 Earth days to
rotate once around its own axis, in a “retrograde” motion that is backwards
from all the other planets. (Earth, obviously, takes only one day.) However,
its high-altitude winds circle the entire planet in only four days.
Furthermore, these winds have:
-
Retrograde atmospheric rotation. The super-rotating outer layers of
Venus’
clouds are rotating in the opposite direction to the planet’s rotational
movement, thereby rotating in the same direction as the other planets. These
high-altitude cloud phenomena require a mechanism to drive the rotation that
is not now seen.
12.6.5 STRUCTURAL / GEOMETRIC ANOMALIES
-
Polar regions hotter than equator. The hot polar regions are obviously a
surprise to scientists; if the Sun were the only source of heat for a planet
we would expect the greatest temperatures to be at the equator. However, the
idea of a Sun-like internal energy source that is fed from streaming energy
at the poles suggests such an observation.
-
“Polar collar cloud” exists at the poles. This cloud formation shows the
entry and exit points of the surrounding energy as it streams into the
planet’s core from the poles.
-
Gravity or planetary waves from mid-latitudes. These gravitational forces
show us that the anomalies of the icosahedral formation on Earth can occur
on other planets as well.
-
Heat waves, jets, particle flow and wind shear at mid-latitudes. Beginning
with the work of Ivan Sanderson, all of these types of phenomena have been
seen on the Earth, corresponding to the icosahedral geometry.
-
Upwardly directed lightning at 30 degree latitude. A land form with volcanic
peaks at 30 degrees South latitude known as Aphrodite Terra shows
upward-moving lightning that is clustered near the peaks Beta and Alta.
These flashes were not correlated with volcanic activity. Again we can see
how powerfully the energy is emanating from these points.
-
Deep atmosphere cooler at equator than 30-degree latitudes. This observation
occurs when we dip below 40 kilometers or 25 miles in the Venusian
atmosphere, and obviously contradicts current planetary models.
-
Time-varying geometric features along equator. Especially in ultraviolet
photographs of Venus, dark shapes including a sideways, geometric “Y”-shaped
feature are seen along the equator. The “Y” feature has been observed to
last for weeks and reappear in four-day intervals of time. We know that this
feature has persisted at the same longitude for at least decades. These
formations are situated between the two 45-degree latitudes and are about
1,000 km/600 miles in length, moving with apparent angular motion at the
equator. [Note: Each node point of the dodecahedron is comprised of three
lines that form into the shape of a “Y.”]
-
Anomalous tectonic features. Venus has a crust that is believed to be too
thin and hot for the conventional plate tectonics model to work there.
However, there are indeed tectonic features, fractures that are at nearly
right angles known as transform faults, and rift valleys. Venus also has a
canyon that is much larger than the Grand Canyon on Earth, and it is right
along the equator. In conventional tectonic models, the surface of Venus is
expected to be relatively smooth. These anomalies suggest the expansion
hypothesis and the geometry of the Fields working in tandem.
12.7 MARS
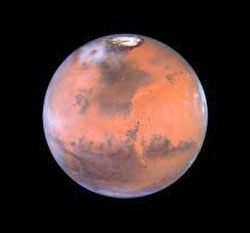 Earth is the third planet from the Sun after Venus, and Mars is the fourth.
Mars is also the seventh largest planet in the Solar System. Its diameter is
6,794 km, and its mass is 6.4219e23 kg. It has a significantly elliptical
orbit, which can cause extreme climate and temperature changes. Though its
average temperature is 218 K (-55 C, -67 F,) it can be as cold as 140 K
(-133 C, -207 F) in the winter and as warm as 300 K (27 C, 80 F) in the
summer. This would obviously make a modern attempt at colonization very
difficult without some form of enclosed dome. The Red Planet was visited
first by Mariner 4 in 1965 and was followed by several others including the
two Viking landers in 1976. Many other probes have attempted to visit Mars
and experienced highly unusual disasters, and some such as
Dr. Zecharia
Sitchin have suggested that this is due to intelligent interference. In
recent times there has been much publicity about Mars having been just like
Earth in its past, with oceans, running water, an atmosphere and even life.
Clear evidence shows that Mars still has a blue sky, areas of water and
possible life. Earth is the third planet from the Sun after Venus, and Mars is the fourth.
Mars is also the seventh largest planet in the Solar System. Its diameter is
6,794 km, and its mass is 6.4219e23 kg. It has a significantly elliptical
orbit, which can cause extreme climate and temperature changes. Though its
average temperature is 218 K (-55 C, -67 F,) it can be as cold as 140 K
(-133 C, -207 F) in the winter and as warm as 300 K (27 C, 80 F) in the
summer. This would obviously make a modern attempt at colonization very
difficult without some form of enclosed dome. The Red Planet was visited
first by Mariner 4 in 1965 and was followed by several others including the
two Viking landers in 1976. Many other probes have attempted to visit Mars
and experienced highly unusual disasters, and some such as
Dr. Zecharia
Sitchin have suggested that this is due to intelligent interference. In
recent times there has been much publicity about Mars having been just like
Earth in its past, with oceans, running water, an atmosphere and even life.
Clear evidence shows that Mars still has a blue sky, areas of water and
possible life.
Mars has two moons, Phobos and Deimos, both of which have unusual qualities
that suggest that they might be hollow inside. They move very fast and
overly close to the surface. Furthermore, exactly one half of the surface
crust of Mars has massive cratering, whereas the other half shows very
little. This, combined with similar observations on the moons of Jupiter and
Saturn, lends significant support to Dr. Tom Van Flandern’s idea that Mars
was once a satellite of planet that had exploded, now seen as the asteroid
belt. This would account for its currently “devastated” condition, where
ostensibly life had once been thriving enough to create the Cydonia city.
12.7.1 MAGNETIC ANOMALIES
1. Little or no magnetic field. Since Mars has a solid outer crust and inner
density similar to the Earth, it is expected to have a magnetic field that
is at least two orders of magnitude greater than what is actually seen. If
it has such a field at all, it might be time-varying. It is possible that
the hypothesized planetary explosion caused this energetic damage.
2. High-velocity flow. On the side of Mars opposite the Sun, the weak
magnetic fields that have been observed flow at speeds that are much faster
than could be explained by centrifugal force alone. This suggests that a
luminous core is at the center that is serving as an energetic particle
accelerator.
12.7.2 TIME-VARYING PHENOMENA
1. Changing polar stress patterns. The simple idea of a flowing convection
movement within the magma of Mars does not explain the time-varying stress
patterns that are seen at the poles, moving towards the interior. This is to
be expected in the new model.
2. Tectonic and other phenomena vary with solar activity. Tectonic behavior
that is correlated with the solar output again makes the powerful suggestion
that the various processes of movement in Mars are linked with the instreaming energy from the Sun.
12.7.3 LUMINOUS / ENERGETIC PHENOMENA
1. Darkened waves. The mid-latitude regions, which are so important in the
Field-dynamical model due to the geometry, show wavelike areas of darkened
color.
2. Bright and dark spots. These have also been seen at the all-important
mid-latitude regions and also suggest currently unexplained energetic
behavior.
12.7.4 IONOSPHERIC / ATMOSPHERIC ANOMALIES
1. Spiral clouds with a narrow jet at the North Pole. These clouds reach 50
kilometers or 86 miles in depth, whereas current theories suggest that they
should be only 6-7 kilometers, or 10.7-11.3 miles. These clouds are very
similar to hurricane or tornado clouds on Earth. Again, we are seeing instreaming energy at the poles, as we would expect.
2. Weather phenomena with solar connections. In the geometrically-defined
mid-latitude regions, there are very active weather events that are timed in
concordance with the solar activity.
3. Parallel clouds and dust storms at mid-latitudes. Clouds that run in
parallel formations and dust storms also suggest that the mid-latitude areas
are more energetic.
4. Temperature and pressure fluctuations at mid latitudes. Again,
Pasichnyk’s new model geometrically explains why there would be changes in
heat and pressure in these zones.
12.7.4 STRUCTURAL / GEOMETRIC ANOMALIES
1. “Pinwheel” plate stackings at poles. This remarkable discovery at the
polar regions shows that different plate units are stacking up like
pinwheels, somehow flowing together in a clear vortex pattern! These
patterns occur within circle-shaped basins at the poles, in perfect
accordance with what we would expect for the main nodes of these energy
fields.
2. Gravity waves related to mid-latitudes. In conventional models gravity
should be smooth; however, beginning with Sanderson’s research we now can
suggest that mid-latitude gravity anomalies would be seen on other planets
such as Mars.
3. Tectonic features between 40 degree latitudes. These areas of seismic
activity are allegedly formed by rotation only in the conventional view, but
they fit this model also.
12.8 JUPITER
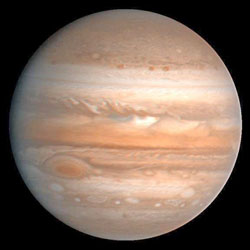 Jupiter is fifth planet and by far the largest in our Solar System. It is
more than twice as large as all the other planets combined, and it would
take 318 Earths to fill its volume. Its diameter at the equator is 142,984
km and it is believed to weigh 1.900e27 kg. It was first visited by Pioneer
10 in 1973, and later Pioneer 11, Voyagers 1 and 2,
Ulysses and most
recently, Galileo. Jupiter is a gas planet, which does not have a solid
surface but simply gets denser with depth. Recent studies suggest that it
contains a small, rocky, Earthlike core that is about 10 or 15 times as
large as Earth is now. Its gases are about 90 percent hydrogen, 10 percent
helium and traces of methane, water, ammonia and rock, which is believed to
be similar to the hypothesized planetary nebula that is thought to have
given birth to the planets. Above the rocky core is liquid metallic hydrogen
that contains ionized protons and electrons like the Sun, but at a lower
temperature. Like other gas planets, Jupiter has high-velocity winds that
counter-rotate in adjacent belts, where the light-colored belts are called
“zones” and the dark-colored belts are called “bands.” Counter-rotating
clouds should require counter-rotating energy fields to drive themselves
along. Jupiter is fifth planet and by far the largest in our Solar System. It is
more than twice as large as all the other planets combined, and it would
take 318 Earths to fill its volume. Its diameter at the equator is 142,984
km and it is believed to weigh 1.900e27 kg. It was first visited by Pioneer
10 in 1973, and later Pioneer 11, Voyagers 1 and 2,
Ulysses and most
recently, Galileo. Jupiter is a gas planet, which does not have a solid
surface but simply gets denser with depth. Recent studies suggest that it
contains a small, rocky, Earthlike core that is about 10 or 15 times as
large as Earth is now. Its gases are about 90 percent hydrogen, 10 percent
helium and traces of methane, water, ammonia and rock, which is believed to
be similar to the hypothesized planetary nebula that is thought to have
given birth to the planets. Above the rocky core is liquid metallic hydrogen
that contains ionized protons and electrons like the Sun, but at a lower
temperature. Like other gas planets, Jupiter has high-velocity winds that
counter-rotate in adjacent belts, where the light-colored belts are called
“zones” and the dark-colored belts are called “bands.” Counter-rotating
clouds should require counter-rotating energy fields to drive themselves
along.
In 1610, Galileo discovered the four large moons of Jupiter, which are Io,
Europa, Ganymede and Callisto, and this gave major support to
Copernicus’
heretical concept that the Sun was at the center of the Solar System.
Galileo was thus imprisoned for the rest of his life and forced to
officially recant his beliefs by the priestly hierarchy. At the time of this
writing a total of 12 smaller moons are acknowledged to exist around Jupiter
as well. Interestingly, Io, Europa and Ganymede orbit each other in a
harmonic ratio of 1 to 2 to 4, and it is believed that Callisto will
eventually join this ratio in a few hundred million years at exactly twice
the orbit of Ganymede and eight times the period of Io. The conventional
explanation for this is “orbital resonance” and in the vibrational aetheric
model it is totally accounted for. Such “resonance” is also seen in the
asteroid belt, in what are known as the “Kirkwood resonance gaps.” These
clear-cut spaces between different bands of asteroids follow the basic
principles of music and vibration.
12.8.1 JUPITER MAGNETIC ANOMALIES
1. Very large in size. Jupiter’s magnetic field extends out to one hundred
times its radius, due to it being four times stronger than Earth’s magnetic
field. This therefore exerts a major energetic impact on other planets in
our Solar System in the aetheric model.
2. Magnetosphere / equatorial current connection. As Jupiter’s magnetosphere
compresses, the equatorial current is activated; again, this is predicted in
the new model and was seen in Walter Russell’s experiments.
12.8.2 TIME-VARYING PHENOMENA
1. Radio bursts. These are caused by particle flow that occurs along the
magnetic lines of force, and the phases of Jupiter’s largest moon Io are
almost entirely responsible for them. This shows the connection of external
bodies to the internal energy processes, as the work of Prof. Shnoll on
atomic and molecular reactions would lead us to believe.
2.
Hydrogen enhancements at the poles. The levels of both atomic and
molecular hydrogen have been seen to vary with time at the polar regions,
showing us again the areas of streaming energy that we expect to find.
3. Cloud boundaries. Clear boundaries exist between cloud belts and systems,
and they display time-varying properties and counter-rotation, showing us
the opposing fields.
4. GRS fluctuates with solar activity. The
Great Red Spot of Jupiter shows
changes that occur in sync with solar activity. Others have made connections
between GRS changes and the phases of Jupiter’s four main moons, again
showing external influences on Jupiter’s energetics, which current models
do not expect to see.
12.8.3 LUMINOUS / ENERGETIC PHENOMENA
1. Large, unexpectedly strong aurora. As observed on March 5, 1979, Jupiter
has an aurora that is 29,000 kilometers or 18,000 miles wide at the North
Pole, the largest we have ever seen. This aurora is much stronger than
present models would believe; it also exhibits lightning storms.
2.
16 times more ions flow into the magnetosphere than expected. These
energetic oxygen and sulfur ions are notably too strong for the current
model, again suggesting a more powerful internal energy source than we have
been led to believe.
 3.
More energy radiated than received from Sun. Again, different
interpretations have come about for why so much extra energy is being
released, but none seem to hold up; in short, Jupiter must have a strong
internal source of energy as we have proposed. 3.
More energy radiated than received from Sun. Again, different
interpretations have come about for why so much extra energy is being
released, but none seem to hold up; in short, Jupiter must have a strong
internal source of energy as we have proposed.
4. Dark rings. Jupiter was not expected to have any rings, but they were
indeed discovered by Voyager 1, much smaller and fainter in color than
Saturn’s.
12.8.4 IONOSPHERIC / ATMOSPHERIC ANOMALIES
1. Particles blocked between hemispheres. For some currently unknown reason,
the particles that develop along magnetic field lines in one hemisphere do
not transfer to the other. In Pasichnyk’s model this shows us that they are
being accelerated into the equatorial region before they would ever cross
the equator.
2. Polar regions lack atmospheric gases. The lack of gases at the poles
again shows us that they are being cleared away by a flow of energy and
particulate matter with the interior of the planet, which centers in the
polar regions.
3. Distinct color changes at 30 degrees. At the thirty-degree latitudes, the
color of Jupiter’s clouds change dramatically. This again shows us that at
the points defined by the geometry, we see anomalous phenomena.
4.
Counter-rotating cloud belts with sharp boundaries. No solid explanation
in known atmospheric models has been given for these counter-rotating
atmospheric anomalies.
12.8.5 STRUCTURAL / GEOMETRIC ANOMALIES
1. X-rays at the poles. These energetic bursts are typical of particle
acceleration and have been seen at both the North and South poles, again
showing us the flowing energy system at work.
2. Auroras accelerated at 180 degrees longitude. We should remember that the
180-degree longitude line divides a planet perfectly in half. This faster
movement of the aurora within a clearly geometrically-defined area shows us
an anomaly that fits with the new model and is not understood
conventionally. When we remember the geometry of the Global Grid this is
much easier to understand.
3. Polar wind of hydrogen. Again this shows the
streaming energy at the
poles, indicating the activity of the CU.
4.
Unusually warm features at 35-degree latitudes. The heating from the Sun
is expected to be the strongest at the equator, and yet this observation
perfectly fits the new model.
5. Faster-moving mid-latitude winds. Normally we would expect the equator to
have the fastest winds, but instead they peak at the 20 to 30 degree
latitudes and less so at the 10-degree latitudes.
12.9 SATURN
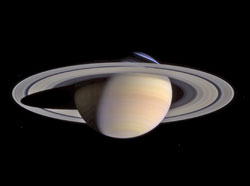 This is the sixth planet from the Sun and the largest after Jupiter. Its
diameter is 120,536 km at the equator, and its mass is 5.68e26 kg. It was
first observed by Galileo in 1610, and the geometry of the rings was not
determined until 1659 by Christian Huygens. It was first visited by
Pioneer
1 in 1979 and later by Voyager 1 and 2. Saturn is by no means a perfect
sphere, as there is an almost 10-percent flattening between the polar
regions as opposed to the equator, which is visible in a telescope. This
“oblate” spherical shape is believed to be caused by its rapid rotation, but
we remember that in Walter Russell’s experiments it could be formed by
simply increasing the distance between the two sources of the spiraling,
conical magnetic fields that intersect in a spherical form. As a gas planet,
Saturn’s atmospheric composition is very similar to Jupiter’s, including all
the trace elements seen on Jupiter. However, its two main gaseous
constituents show a higher balance of helium than Jupiter, with 75% hydrogen
and 25% helium. It has very visible rings, three of which can be seen from
the Earth in a telescope. Even so, they are very flat at only 1.5 kilometers
thick, and there is so little material in the rings that if they were all
compressed into a single body, the resulting mass would be no more than 100
kilometers wide. Saturn also has a small, Earthlike rocky core at its
center, like Jupiter. This is the sixth planet from the Sun and the largest after Jupiter. Its
diameter is 120,536 km at the equator, and its mass is 5.68e26 kg. It was
first observed by Galileo in 1610, and the geometry of the rings was not
determined until 1659 by Christian Huygens. It was first visited by
Pioneer
1 in 1979 and later by Voyager 1 and 2. Saturn is by no means a perfect
sphere, as there is an almost 10-percent flattening between the polar
regions as opposed to the equator, which is visible in a telescope. This
“oblate” spherical shape is believed to be caused by its rapid rotation, but
we remember that in Walter Russell’s experiments it could be formed by
simply increasing the distance between the two sources of the spiraling,
conical magnetic fields that intersect in a spherical form. As a gas planet,
Saturn’s atmospheric composition is very similar to Jupiter’s, including all
the trace elements seen on Jupiter. However, its two main gaseous
constituents show a higher balance of helium than Jupiter, with 75% hydrogen
and 25% helium. It has very visible rings, three of which can be seen from
the Earth in a telescope. Even so, they are very flat at only 1.5 kilometers
thick, and there is so little material in the rings that if they were all
compressed into a single body, the resulting mass would be no more than 100
kilometers wide. Saturn also has a small, Earthlike rocky core at its
center, like Jupiter.
The two largest moons of Saturn are Titan and Rhea, and there are a total of
18 named satellites at the present time. Three different pairs of moons have
stable, “harmonic” interactions. Mimas’ orbit is exactly half of
Tethys, or
a 1:2 resonance. Enceladus and Dione are also 1:2 and
Titan and Hyperion are
3:4. This is only explained conventionally by ideas of “resonance” in
gravity.
12.9.1 MAGNETIC ANOMALIES
1. Significant magnetic field. Saturn’s magnetic field also has a far reach
like Jupiter’s, and in the new model can therefore have long-range energetic
effects, especially when there are specific geometric interactions between
Jupiter and Saturn such as conjunctions or 180-degree oppositions. Later we
will show that these interactions can actually affect the quality of radio
broadcasts even more than the peak sunspot activities, and suggest that
these conjunctions act as the “driver” of other long-term cycles in the
Solar System.
2. Magnetosphere responsive to solar wind. The direct effect of the solar
wind on Saturn’s magnetic field again shows the importance of the Sun’s
energy in planetary processes.
3. Magnetic and rotational axis identical. Satellite measurements have
confirmed that on Saturn, the magnetic axis is in precise alignment with the
rotational axis. This is a surprise for current models, as normally these
fields are offset from each other somewhat. In the new model, this precise
alignment could well be the reason for why the rings of Saturn are so
prominent; the fields line up perfectly to create them.
4.
Braided formations in the F-ring. These strange, braided “knots” were
observed in Voyager 1 images but not in Voyager 2 images. This
three-dimensional structure is certainly not what we would expect to see if
the rings were simply gas and dust; it looks very much like a complex, vortexual magnetic field, as the new model suggests would appear when you
have two different counter-rotating, spiraling fields interacting there.
12.9.2 TIME-VARYING PHENOMENA
1. Impulsive radio discharges. These discontinuous radio bursts are
difficult to explain in current models, which do not provide a reason for
phenomena that change with time.
2. Polar aurora. The aurora over the poles is not seen steadily, but rather
changes with time and with solar activity, as we would now expect.
3. Irregular brightness variations. Saturn’s overall brightness, as well as
that of its rings, shows time-varying changes that synchronize with solar
activity. However, this synchronization is irregular, suggesting other
influences besides the Sun.
4. Mysterious ring disappearances. Since the eighteenth century, Saturn’s
rings have been known to occasionally disappear on one side altogether. In
other cases, as first observed by astronomer Maurice Ainslie, luminous balls
of ionizing radiation have been seen to move through the rings and absorb
ring material. This is what we would expect if the core of Saturn were
releasing natural self-luminous formations that absorbed the energetic
plasma material that is actually forming Saturn’s rings. We remember that
properties two and three of Dr. Dmitriev’s “vacuum domain” list are that
they can absorb and emit light and / or electromagnetic fields.
12.9.3 LUMINOUS / ENERGETIC PHENOMENA
1. Saturn Electrostatic Discharge. As our space probes passed through the
equator area, we were surprised to discover that Saturn had a very large
energetic discharge. We now know that it revolves or rotates like a
search-light beacon and is very narrow, within less than 5 minutes of a
degree of latitude. This strongly suggests that a geometric structure is
forming the field. A stabler energetic current is seen along the plane of
the rings as well.
2. Hydrogen glow near rings. This glow of excited hydrogen ions suggests
that the rings are being fed by an energetic source, not simply gas and
dust.
3. 2.4 times extra energy radiated out. Saturn
radiates 2.4 times more
energy than it receives from the Sun, in defiance of known models and
understandings.
4. Bright spots that form bands. Spherical white spots have been seen in
1876, 1903, 1933 and 1960, and in September 1990 another was seen. In the
new model these would be “vacuum domains” or natural self-luminous
formations emerging from the planet’s energetic core. The spot that was seen
in 1990 first spread out into a 21,000-kilometer or 1,305-mile oval, and by
November it had fully expanded to become a planet-encircling band. This
strongly suggests that these bands are being formed by internal energy
emissions that get caught up in the rotation of the field whose influence
they are under at that particular latitude, then spreading out into the
atmosphere. And more importantly still, we see that the time periods between
the sightings of these white spots correspond closely to Saturn’s 29.4-year
orbit around the Sun, again suggesting that Saturn’s energetic processes are
closely related to its movement relative to the Sun. Let’s also remember
that Dr. Dmitriev made a direct correlation between the number of
NSLFs seen
on Earth and the amount of solar activity that was occurring at the same
time.
12.9.4 IONOSPHERIC / ATMOSPHERIC ANOMALIES
1. Heating of the atmosphere. Without a radiant internal energy source it is
difficult to explain why Saturn’s atmosphere has the heat that it does,
especially near the center, where temperatures react twelve thousand degrees
Kelvin.
2. Brightening and wind at the poles. The extra brightness and energetic
wind currents in the polar regions seem to again be showing us a vortex
energy flow into the center of the planet, where we expect there to be the
presence of “undifferentiated solar matter.”
3. X ray emissions at poles. These polar X-rays occur during auroras and
show “nuclear particle accelerator” properties inside Saturn.
4.
Helium emitted at the poles. The helium that emerges from Saturn’s poles
also shows nuclear qualities in the core, and again illustrates the
streaming polar energy motion.
12.9.5 STRUCTURAL / GEOMETRIC ANOMALIES
1. Ring grooves. The grooves between Saturn’s rings are so numerous that it
appears to be a phonograph record; this seems to be showing us a sketch of a
multiplicity of nested spherical fields of energy that are all interacting
precisely at the equatorial region. These grooves could obviously not be
formed by conventional gravity concepts.
2. Inwardly moving ring waves. In the conventional model involving only
centrifugal force, the rings should be moving away from the planet, not
towards it. We remember that Walter Russell’s experiment demonstrated a ring
with electromagnetic fields only, thus showing that it has nothing to do
with simple gravitation, more to do with an intersection of forces on the
equatorial plane of the CU or spherical torus. In the new model, the two
fields geometrically interact at the equator, their perfect point of
balance, and are then absorbed into the center.
3. “Spokes” in the B-ring. We can actually see time-varying geometric
changes in the second ring or “B-ring” that show up as wedge-shaped
formations, which radiate out from the center of the planet. Yes, that’s
right, straight-lined geometric structures of energy! This again shows a
geometric magnetic field, and is best explained by seeing a funnel-shaped
vortex that is formed from the center of the planet.
4.
45-degree spoke spacings. The spokes mentioned above show the greatest
activity in evenly spaced intervals of 45-degrees longitude. This is
remarkably close to where the nodes of the icosahedron are divided up across
the surface of a sphere! Should there be a cube / octahedral field acting
here it would be a perfect fit, as eight sides times 45 is 360.
5.
Non-gravitational ring irregularities. We have already mentioned some of
these, such as very thin rings, the fine spaces between the rings, the
grooves and the spokes. There are also rings with eccentric shapes,
spiraling formations, rippling formations and kinks that develop. None of
these formations should appear by the effects of gravity, which is where
most theories will stop in their explanatory efforts.
12.10 URANUS
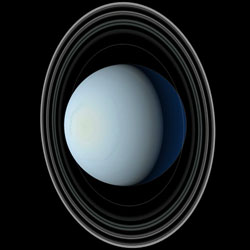 This blue-colored, gaseous planet was discovered by
William Herschel on
March 13, 1781. It has only been visited by one spacecraft, and that was
Voyager 2 on Jan. 24, 1986. Interestingly, its axis of rotation almost
directly faces the Sun, unlike all other planets in the Solar System. It is
less gaseous than Jupiter and Saturn, having about 15 percent hydrogen and a
small amount of helium, with the rest being rock and various forms of ice.
Its mass seems to be uniformly distributed, without any extra density near
the core. However, both Uranus and Neptune seem to have similar compositions
as the cores of Jupiter and Saturn, except for the lack of a large-scale
liquid metallic hydrogen structure that is formed by temperature and
pressure. Uranus also has cloud bands that make rapid movements across the
surface, like the other gas planets. It has eleven known rings, all of which
are very faint. The brightest ring is known as the Epsilon ring. This blue-colored, gaseous planet was discovered by
William Herschel on
March 13, 1781. It has only been visited by one spacecraft, and that was
Voyager 2 on Jan. 24, 1986. Interestingly, its axis of rotation almost
directly faces the Sun, unlike all other planets in the Solar System. It is
less gaseous than Jupiter and Saturn, having about 15 percent hydrogen and a
small amount of helium, with the rest being rock and various forms of ice.
Its mass seems to be uniformly distributed, without any extra density near
the core. However, both Uranus and Neptune seem to have similar compositions
as the cores of Jupiter and Saturn, except for the lack of a large-scale
liquid metallic hydrogen structure that is formed by temperature and
pressure. Uranus also has cloud bands that make rapid movements across the
surface, like the other gas planets. It has eleven known rings, all of which
are very faint. The brightest ring is known as the Epsilon ring.
Uranus has the most known moons of any planet, with 20 that have been named.
There are eleven that are very small, dark and near to the planet, which
were discovered by Voyager 2. The five larger moons are Miranda,
Ariel, Umbriel and Titania, and four other much more distant moons have been
recently discovered. Except for the four distant moons, they have nearly
circular orbits around Uranus’ equator, and are therefore also tilted at an
almost perpendicular angle against the normal flat plane in which the Sun’s
planets orbit, known as the ecliptic. The work of
Dr. Zecharia Sitchin has
demonstrated a harmonic relationship between the inner moons.
12.10.1 MAGNETIC ANOMALIES
1. Complex, unexpected magnetosphere. Originally, since Uranus doesn’t show
signs of a thick core, dynamo theorists did not expect it to have a magnetic
field. In fact, it has a very complex magnetic field that was completely
unexpected, which Pasichnyk insists is “showing more of the Field-dynamical
Model than most other Voyager observations of the other planets.”
2.
Nested magnetic fields. Surprisingly, Uranus has a magnetosphere inside
of another magnetosphere; and this is a clear sign of there being two main
“nested” spherical energy fields that are interacting with each other.
3. Magnetic lines return before reaching equator. Among these two main
fields, some of the magnetic lines of force are seen to “dive back” into the
planet before reaching the middle point at the equator. This anomaly fits
the Field-dynamical model as well by showing where the fields are
interfering, canceling each other out and then being absorbed into the
energetic core of the planet.
4. Convection and co-rotation. Just like the Earth,
Uranus’ magnetic fields
show signs of a circulating convection flow, and the fields also rotate
along with the planet’s movement.
5. Magnetic field offset by 55 to 60 degrees.
Dr. Dmitriev ascribes
significance to the conventional explanation that this 55 to 60-degree
offset, measured by Voyager 2 in 1986, is due to Uranus having had a recent
magnetic pole shift; Pasichnyk disagrees. In the Field-dynamical Model we
could think of this “offset” as actually a measurement of a very strong
magnetic field at 30 degrees latitude, where we would expect it from the
geometry of the icosahedron. Current magnetic models only expect to see a
“dipole” field, meaning that a planet would have a north and south pole
only; such multi-pole systems as this are not believed to exist on planets,
but they have been observed in stars.
12.10.2 TIME-VARYING PHENOMENA
1. Polar radio emissions with six separate time-varying components. At the
weak “North Magnetic Pole” of Uranus, we see a source of radio emissions
that varies with solar emissions and has at least six separate components.
This suggests a complex system that is partially being driven by the energy
from the Sun, as we would expect.
2. Enhancements of proton and electron flows. In the down-streaming
magnetosphere of Uranus, there will be repeating, periodic enhancements in
the flow of charged protons and electrons. This is well accounted for in the
Field-dynamical model.
3. Hydrogen column varies by a factor of two in 24 hours. The Lyman-alpha
hydrogen column on Uranus is stronger than conventional models expect, and
during the course of 24 hours it will vary by a factor of two; this is also
an indication of a magnetic field in Pasichnyk’s model.
12.10.3 LUMINOUS / ENERGETIC PHENOMENA
1. Auroral zones closer to “equator” than poles. Another surprise offered by
Uranus is that the aurora do not cluster around the poles as we have seen in
most other planets, including Earth. This suggests that even though Uranus
rotates perpendicular to the Sun, the solar energetic currents are
strengthening other areas of the magnetic geometry that are aligned with the
solar wind, thus causing the aurora to materialize around the equator.
2. Auroras are “self-excited.” The auroras on Uranus are not correlated with
solar activity for the most part; they are driven from internal processes
and then disturb the upper atmosphere. We remember that Uranus does not show
any evidence of a solid core, thus the idea of a Sun-like energetic center
is the most likely explanation.
12.10.4 IONOSPHERIC / ATMOSPHERIC ANOMALIES
1. Anomalous high temperature in upper atmosphere. The upper atmosphere of
Uranus reaches temperatures of 750 degrees Kelvin, which cause it to spread
out fully 6,000 kilometers or 3,725 miles above the clouds.
2.
30 percent of atmospheric heat from within Uranus. The high temperatures
that have been observed in the Uranian atmosphere cannot be accounted for by
solar radiation; we require there to be an internal source of heat and
energy as the model suggests.
3. South Pole not hot enough. Since the Sun is always shining directly on
Uranus’ rotational south pole, we would think that it would be hotter than
the rest of the planet. In fact, the planetary temperatures are fairly
uniform, even at the darkest area in the North Pole.
4. Lowest temperatures at 30 degree latitudes. This again fits with the
geometry of the icosahedron, as seen in the new model. Furthermore, the
equator shows the highest temperature even though it is not facing the Sun
as Uranus rotates.
12.10.5 STRUCTURAL / GEOMETRIC ANOMALIES
1. Double helix formation in the tail of field. Just as we would expect from
spiraling vortex processes, in the tail of Uranus’ magnetic field we find a
double helix formation. The current names given to this are “airglow” and
“electroglow,” since the conventional explanation is that it is caused by
electrons that are charging and reacting with hydrogen in the upper
atmosphere.
2. 30-degree convection cells with vertical winds. At either side of the
30-degree latitudes, Uranus shows convection cells. In these areas there is
a significant blending of the clouds with the atmosphere, and there is wind
shear seen in a vertical direction. The icosahedral geometry is very clear
from analyzing this behavior, as the winds are normally expected to be only
in a horizontal direction.
3. Counter-rotating winds and cloud layers.
At the equator of Uranus, the
winds flow in the opposite or retrograde direction to the rotational
direction, and the mid-latitude winds flow with the rotation. This is also
seen on the Earth and shows the presence of counter-rotating energetic
fields that drive atmospheric processes. Furthermore, as we move up in
latitude we continually see counter-rotating areas, as with the Sun,
Jupiter, Saturn and Neptune.
4. Mid-latitude chemical variations. Ammonia on Uranus is concentrated
between the 15 and 45-degree latitudes, showing the focus at the 30-degree icosahedral center. The strongest amount of ammonia is seen between 30 and
40 degrees in the South latitude, and there is a noticeable absence of
ammonia at the south pole. Furthermore, concentrations of methane gas are
reduced at the 30 degrees South latitude, and this is what we would expect
in the presence of charged “particle” flow from an energetically active
center.
5. Radiation centered at 45-degree latitude. As lightning releases in the
atmosphere of Uranus, it forms a radio emission known as the Uranian
Electrostatic Discharge. This radiation centers around 45 degrees South
latitude. There is also a region in the Southern hemisphere that is very
energetically quiet, again showing geometric constraints.
12.11 NEPTUNE
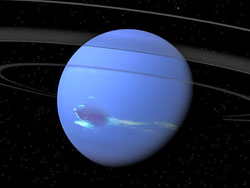 Neptune is the second-to-last known planet from the Sun and has the fourth
largest diameter of any planet. It is smaller in diameter than Uranus but
also has a larger mass, with an equatorial diameter of 49,532 km and a mass
of 1.0247e26 kg. It was first conceived of by the study of various changes
that occurred in the orbit of Uranus, and later observed by Galle and
d’Arrest on September 23, 1846. Most of our knowledge of Neptune has come
from the single encounter of Voyager 2 on August 25, 1989, which was later
combined with other important observations from the Hubble Space Telescope.
It can become the most distant planet in the Solar System when Pluto’s
eccentric orbit crosses inside of it. We now know that it is blue in color,
has counter-rotating cloud bands and is believed to have a similar
atmospheric composition as Uranus, with various “ices”, rock, about 15
percent hydrogen and a slight amount of helium. It also appears to be
uniform throughout its interior in density like Uranus. The blue color is
believed to be from the absorption of red light by methane in the
atmosphere, but other unknown qualities must be responsible to completely
account for the degree of color that is seen. Neptune is the second-to-last known planet from the Sun and has the fourth
largest diameter of any planet. It is smaller in diameter than Uranus but
also has a larger mass, with an equatorial diameter of 49,532 km and a mass
of 1.0247e26 kg. It was first conceived of by the study of various changes
that occurred in the orbit of Uranus, and later observed by Galle and
d’Arrest on September 23, 1846. Most of our knowledge of Neptune has come
from the single encounter of Voyager 2 on August 25, 1989, which was later
combined with other important observations from the Hubble Space Telescope.
It can become the most distant planet in the Solar System when Pluto’s
eccentric orbit crosses inside of it. We now know that it is blue in color,
has counter-rotating cloud bands and is believed to have a similar
atmospheric composition as Uranus, with various “ices”, rock, about 15
percent hydrogen and a slight amount of helium. It also appears to be
uniform throughout its interior in density like Uranus. The blue color is
believed to be from the absorption of red light by methane in the
atmosphere, but other unknown qualities must be responsible to completely
account for the degree of color that is seen.
Neptune also has the infamous Great Dark Spot at the tetrahedral latitude,
which is about the same diameter as the Earth, and it also had white clouds
that were observed to stream around it at that same “tetrahedral” latitude.
This spot was seen to have apparently disappeared by the HST in 1994, only
to be replaced by another in the Northern hemisphere a few months later,
most likely at the “tetrahedral” latitude again. A small irregular white
cloud orbits Neptune in only 16 hours and is now known as “The Scooter,” and
its nature remains a mystery. Neptune shows us four complete dark-colored
rings with bright clumps, one of which has a twisted, helical structure. It
has one large moon known as Triton and seven known moons that are much
smaller.
12.11.1 MAGNETIC ANOMALIES
1. Magnetosphere tilted 50 degrees from rotational axis. This observation,
coupled with a similar condition on Uranus, has caused some scientists to
rethink how magnetic fields are formed on planets. Again, the conventional
explanation is that Neptune had a recent pole shift, due to the fact that
Neptune and Uranus’ fields are seen to be “magnetically conjugate.” Pasichnyk again points out that this apparent 50-degree tilt could actually
be an activation at the 40-degree latitude of the icosahedral geometry that
is stronger than the polar regions.
2. Non-dipole magnetic characteristics. Once again, we do not see a
uniformly smooth north-south “dipole” magnetic field, but rather a series of
discontinuities like we see on Earth, as we would expect from the geometry.
12.11.2 TIME-VARYING PHENOMENA
1. Small scale features vary hour by hour. In the atmosphere of Neptune,
certain features on a small scale have been seen to change on literally an
hour by hour basis.
2. Changing of the Great Dark Spot. This complete turnaround of the Great
Dark Spot feature from the South to North latitude in a matter of months,
when Jupiter’s Great Red Spot has been seen to remain constant for more than
300 years, certainly shows us that Neptune is capable of rapid change.
12.11.3 LUMINOUS / ENERGETIC PHENOMENA
1. Northern hemisphere now brighter than southern. At one point the southern
hemisphere was brighter than the northern. Then from the late 1970s on, they
were roughly equal. And now the northern hemisphere shows a greater
brightness than the southern, as seen by the University of Hawaii’s
2.2-meter telescope. According to Pasichnyk, “with a Field-dynamical Model
this is no mystery.”
2. Poles and equator warmer than mid-latitudes. This shows us signs of an
internal energy source that is responsible for the planet’s temperature
changes. This is also seen in the behavior of other gas planets despite
their differences in known internal heat mechanisms and total energy
absorbed from the Sun.
3. 2.7 times more energy radiated than received. Again suggesting the
presence of a powerful internal energy source, Neptune radiates 2.7 times
more energy than it receives from the Sun.
12.11.4 IONOSPHERIC / ATMOSPHERIC ANOMALIES
1. Neptune spins too fast. The conventional model had accounted for
Neptune’s higher energy radiance by proposing a 17-hour orbit where the
mixing of the planet’s interior is directly related to how much heat is
released. With the “Scooter” cloud actually showing us a 16-hour orbit, the
“mixing theory” does not add up, again suggesting the internal energy source
proposed in the Field-dynamical Model.
2. Atmospheric speed variations. In lower latitudes near the equator,
Neptune’s atmosphere is subrotating, meaning that it moves slower than the
speed of the planet’s rotation, whereas at higher latitudes it is
super-rotating, moving faster than the planet’s assumed rotational speed.
3. Fastest winds in the Solar System. In certain areas, Neptune’s winds
appear to blow at a tremendous 600 meters per second, or about 1,340 miles
per hour; much higher than a Category Five hurricane on Earth. As Pasichnyk
remarks, since Neptune absorbs much less sunlight and energy than other
planets, “There is no question that these winds are powered by an internal
and powerful energy source.”
12.11.5 STRUCTURAL / GEOMETRIC ANOMALIES
1. Mid-latitude spots with evidence of particle flow. The geometry of the
fields in this new model perfectly accounts for the observation of these
mid-latitude spots.
2. Great Dark Spot changes. To have this spot disappear in one geometric
area and then reappear on the opposite hemisphere is certainly indicative of
a more complex energetic system that is at work, capable of rather rapid
changes.
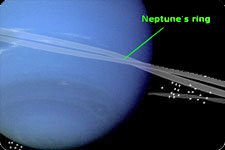 3. “Scooter cloud” 16-hour rotation. Such a high-speed cloud with a small
size would certainly be possible as being indicative of a rotating geometric
energy node. 3. “Scooter cloud” 16-hour rotation. Such a high-speed cloud with a small
size would certainly be possible as being indicative of a rotating geometric
energy node.
4. Helical formations in rings. Again, the observations of “kinks” or
“braids” in the rings completely defies explanation if they are being formed
by gravitational forces alone.
12.12 PLUTO
|
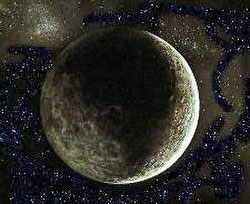
Artist rendered |
Due to its extreme distance from the Earth and relative lack of study, there
are less anomalies to report with Pluto, so we will move away from our
standard five-category format. Pluto is usually the farthest planet from the
Sun and much smaller than all the others at a diameter of 2274 km. This
actually makes it smaller than seven of the moons in the Solar System,
including Earth’s Moon, Io, Europa,
Ganymede, Callisto, Titan and
Triton.
For this reason, some have pushed for it to be downgraded from a planet to a
large comet or asteroid, but this is unlikely to happen.
It has a mass of
1.27e22 kg and was discovered in 1930 by Clyde Tombaugh. It has yet to be
visited by any of our spacecraft, and even the Hubble Space
Telescope can only make out its most obvious surface characteristics. Its moon
Charon was
discovered by Jim Christy in 1978, and by watching how the brightness of the
two bodies changed as Charon moved over Pluto, our scientists were able to
construct a rough map of light and dark areas on both objects.
Pluto has a
very high degree of contrast between these light and dark areas, more than
any other object in our Solar System except the moon Iapetus. This is
considered an anomaly that is worth investigating as a high priority for the
proposed Pluto Express mission, which now appears to have been scrapped in
the new Presidential budget of 2001.
One interesting observation is that Pluto’s areas of higher temperature
roughly correspond to areas that are darker in appearance. It is speculated
that “the composition of the darker areas of Pluto’s surface is unknown but
may be due to primordial organic material or photochemical reactions driven
by cosmic rays.” Pluto’s equator appears to be at an almost 90-degree angle
to its direction of orbit, like Uranus. Most interestingly, Pluto’s orbit is
exactly 1.5 times longer than Neptune’s, giving it a harmonic resonance
ratio of 3:2 with the orbit of Neptune, even though they do not revolve
around the Sun in the same plane due to Pluto’s offset orbit. Furthermore,
Pluto and Charon rotate synchronously, meaning that they always keep the
same face toward each other, just like the Earth and its moon.
Pasichnyk reminds us that Pluto’s ice caps only grow to the equator and a
reddish band exists along the equator, thus suggesting a ring phenomena.
Furthermore, the distribution of dark spots show latitude-restricted
phenomena as well, which is expected in this model.
12.13 RECAP
Due to the length of this chapter and its already highly organized
structure, we will keep this recap short and discuss its implications in the
next chapter.
12.1 The enigmas of Mars that possibly indicate artificial structure were
first called to the world’s attention by the efforts of Richard Hoagland.
12.2 Hoagland and other researchers including Erol Torun determined that the
Martian city Cydonia had encoded the mathematics for the tetrahedron inside
a sphere throughout itself in many different ways, relating to the geometric
placement of objects to each other. This includes the placement of Cydonia
being a symbol for the tetrahedron.
12.2.1 The geometry of the circumscribed tetrahedron is seen at
energetic upwellings all throughout the Solar System, and possibly as a bright spot on
the star Betelgeuse as well. These upwellings are usually volcanic on solid
planets, atmospheric vortexes on gas planets and related to sunspot activity
on the Sun.
12.3 We suggest that the geometry seen in the
icosahedron and tetrahedron,
as related to planetary energy fields, has to do with the properties of
vibration. This also allows the CU to relieve some of the stress that is
seen between its north-south poles when it is flowing in a “polarized”
fashion, which we have shown as creating highly intense gravitational and
energetic forces that could not support a planet.
12.4 - 12.12 From here, we move through an organized description of the data of
Richard Pasichnyk and the Field-dynamical Model, which clearly shows us the
processes of the CU throughout the Solar System. We make two important
points. The first is that the energetic phenomena will be time-variable, and
this is due to the fact that the planets are affected by their relative
positions to each other and the rotational action of the Fields themselves.
The second important point is that planetary rings are formed by there being
two fields that work together on the planets. These two fields are seen to
counter-rotate and also lead to the observation of energy flowing in both
directions at both poles. When the fields intersect, they form a perfectly
flat plane at the planet’s equator. This is what is actually responsible for
planetary rings, and it was demonstrated in the laboratory by Walter
Russell’s experiment involving two cone-shaped magnetic fields.

|